. 2018 Jun 1;360(6392):eaar5780.
doi: 10.1126/science.aar5780. Epub 2018 Apr 26.

The dynamics of gene expression in vertebrate embryogenesis at single-cell resolution

Affiliations

The dynamics of gene expression in vertebrate embryogenesis at single-cell resolution

James A Briggs et al. Science. .

Abstract

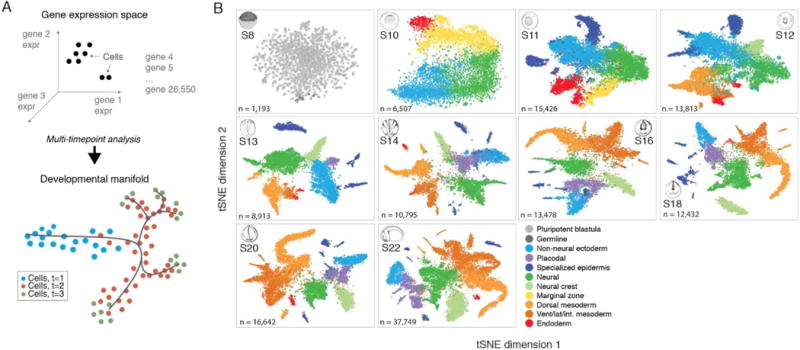
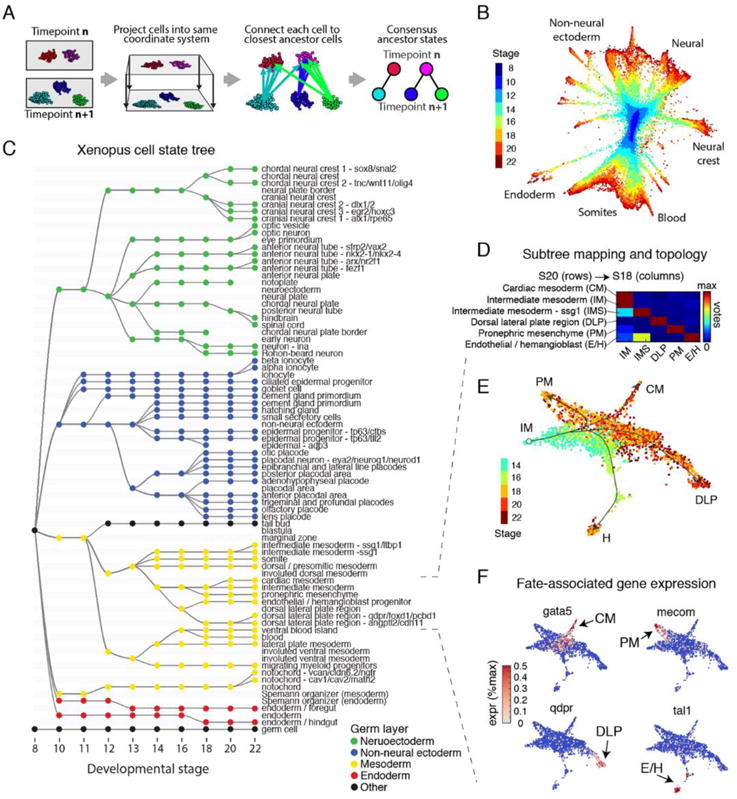
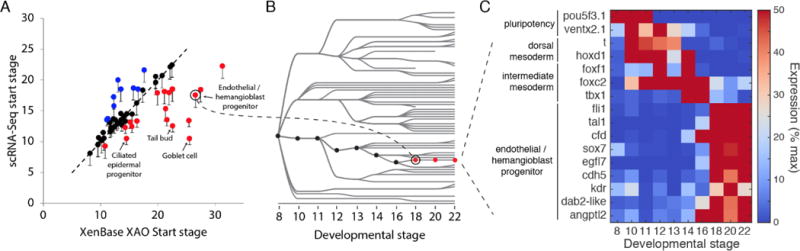
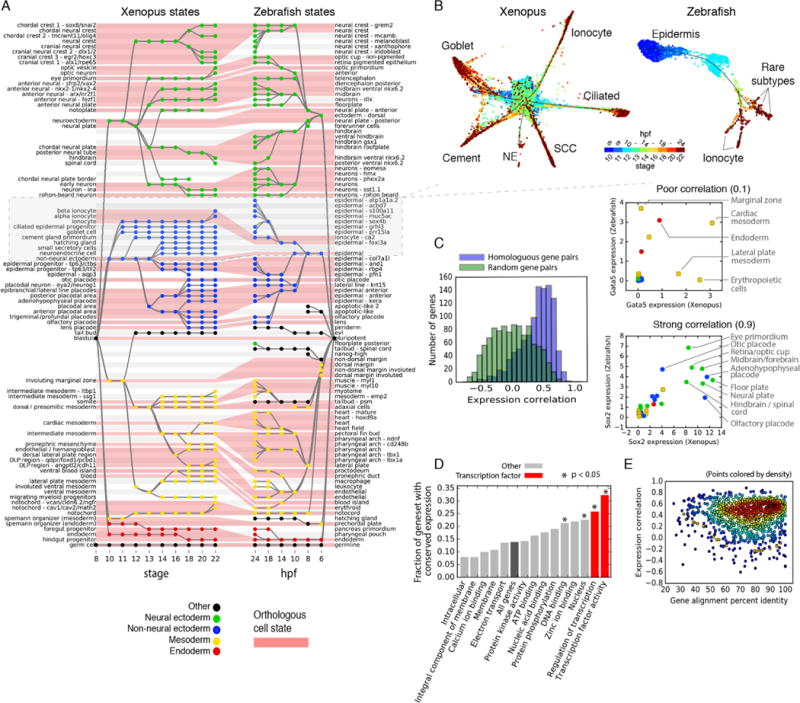
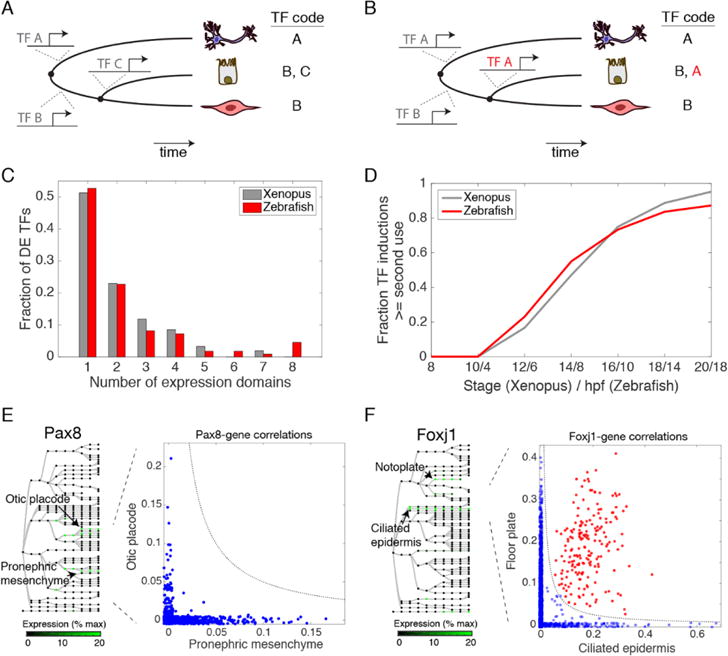
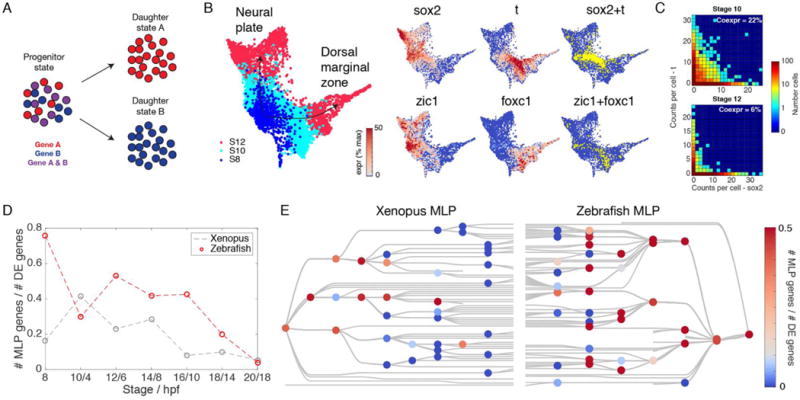
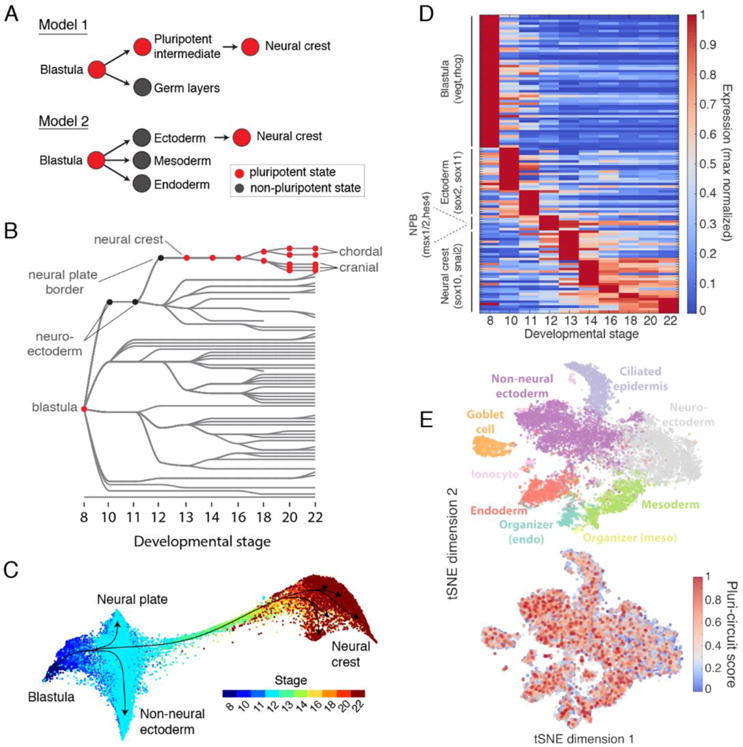
Time series of single-cell transcriptome measurements can reveal dynamic features of cell differentiation pathways. From measurements of whole frog embryos spanning zygotic genome activation through early organogenesis, we derived a detailed catalog of cell states in vertebrate development and a map of differentiation across all lineages over time. The inferred map recapitulates most if not all developmental relationships and associates new regulators and marker genes with each cell state. We find that many embryonic cell states appear earlier than previously appreciated. We also assess conflicting models of neural crest development. Incorporating a matched time series of zebrafish development from a companion paper, we reveal conserved and divergent features of vertebrate early developmental gene expression programs.


Conflict of interest statement

Competing interests: A.M.K. and M.W.K are founders of 1Cell-Bio, Inc. All other authors declare no competing interests.

Figures

Fig. 1
Fig. 1. Dissection of early Xenopus tropicalis development by scRNA-seq
(A) Single-cell transcriptomes represent points in a high-dimensional gene expression space. By collecting single-cell transcriptomes over time of embryo development, it is possible to infer a continuum gene expression manifold connecting cell states across all lineages. (B) Summary of scRNA-seq developmental timecourse including 136,966 single-cell transcriptomes sampled over ten embryonic stages (S8-22). tSNE plots show increasing cell population structure over time. Colors indicate major tissues grouped by germ layer. Further details on subclustering shown in (figs. S3, S5, and S6), and at: tinyurl.com/scXen2018.
Fig. 2
Fig. 2. Inference of developmental cell state transitions from gene expression similarity
(A) Schematic of the mapping algorithm used to make similarity connections between clusters across time. (B) Global visualization of single cells profiled in the Xenopus developmental timecourse using a kNN-graph (Wagner et al.). (C) Cell state tree showing all inferred developmental transitions. Generated by applying the mapping algorithm in (A). (D) Representative cell voting outcomes between time points, generated during state tree construction. (E) Single-cell visualization of a representative sub-tree, showing lateral and intermediate mesoderm fates. Lines indicate corresponding topology of the cell state tree. (F) Marker gene expression associated with the formation of each intermediate mesoderm cell state.
Fig. 3
Fig. 3. scRNA-seq detects early transcriptional events during specification of embryonic cell states
(A) Time of first appearance for each cell state in the cell state tree as compared to documented appearance times in the Xenopus anatomy ontology (XAO). Red/blue points are detected early/late in scRNA-seq as compared to XAO. 60 of 69 states appear as early or earlier than documented. Error bars represent time interval of scRNA-seq experiment. (B and C) scRNA-seq reveals an early endothelial / hemangioblast progenitor that appears at stage 18 (red lineage), as compared to stage 26 for hemangioblasts and stage 31 for endothelial cells [XAO; (12, 13)], with recognizable activation of the endothelial/hemangioblast gene expression program (C).
Fig. 4
Fig. 4. Similarities and differences in developmental cell state hierarchies and gene expression between frog and fish
(A) Xenopus and Zebrafish cell state trees aligned by orthologous cell states (red shading). Gray/white stripes provide a visual guide. (B) Single-cell visualization of matched epidermal subtrees in frog and fish showcase similarities and differences in developmental hierarchy. SCC, small secretory cell; NE, neuroendocrine cell. Unidentified zebrafish cell types are labeled by marker genes. (C) Ortholog genes across species have variable conservation of cell state specific expression. Just 30% of self-similar orthologs are conserved at a 95% FDR compared to random gene pairs. Right panels: examples of highly (Sox2) and poorly (Gata5) correlated TFs across species. (D and E) Function, not sequence, predicts gene expression conservation: (D) Orthologs with highly conserved expression patterns across species are enriched in TF-associated GO terms. P-values show Bonferroni-corrected binomial test results. (E) Protein sequence conservation is not correlated with gene expression conservation (r = 0.01; P = 0.6).
Fig. 5
Fig. 5. TF reuse is pervasive in vertebrate development
(A) Progressive programming of cell identity through sequential TF activation. (B) Programming of cell identity through combinatorial reuse of TFs. TF A is reused (red) in combination with TF B to generate a new fate. (C) Half of differentially expressed (DE) TFs are induced more than once in early frog and fish development. (D) Reused TFs increasingly dominate new TF expression during fate choices over time. (E and F) Reused TFs correlate with context-dependent (blue; off-diagonal) or conserved (red; on-diagonal) gene expression modules: (E) Pax8 correlates with different genes in the otic placode and the pronephric mesenchyme. (F) Foxj1 correlates with ciliogenesis genes in both the floor plate and in ciliated epidermal cells.
Fig. 6
Fig. 6. Refinement of promiscuous multilineage gene expression during early embryonic fate choices
(A) Illustration of multilineage priming (MLP). Two genes, specific to daughter states A and B respectively, transiently overlap in the ancestor progenitor state as a fate decision is being made. (B and C) MLP during the fate choice between neural plate and dorsal marginal zone in Xenopus. Sox2 and T, as well as Zic1 and Foxc1, overlap in progenitor cells before becoming specific. (D and E) Global patterns of MLP in early development: (D) Multilineage primed genes are initially pervasive among differentially expressed (DE) genes at fate branch points, but become progressively rarer. (E) MLP frequency shown for each cell fate choice on the cell state trees indicates sporadic MLP at later time points.
Fig. 7
Fig. 7. Assessing the retention of pluripotency during neural crest development
(A) Contrasting models of neural crest development. Model 1: neural crest emerges from an intermediate population that retains blastula pluripotency (29). Model 2: neural crest emerges from ectoderm and reactivates pluripotency. (B) Ancestors inferred from scRNA-seq support model 2, where neural crest derives from neural cells at the neural plate border. (C) Single-cell visualization (SPRING) of neuroectoderm, non-neural ectoderm, and neural crest also indicates that neural crest derives from the neural plate border. (D) Neural crest differentiation involves hundreds of >3- fold dynamic marker genes. (E) At stage 11, the shared pluripotency circuit proposed by Buitrago-Delgado et al. (30) - foxd3, c-myc (myca), id3, tfap2a, ventx2.1, ets1, and snail and pou3f5.2 - is expressed broadly in nonpluripotent cells. Score shows normalized aggregate expression; see fig. S18 for individual genes.

Comment in

References

    1. Klein AM, Mazutis L, Akartuna I, Tallapragada N, Veres A, Li V, Peshkin L, Weitz DA, Kirschner MW. Droplet barcoding for single-cell transcriptomics applied to embryonic stem cells. Cell. 2015;161:1187–1201. doi: 10.1016/j.cell.2015.04.044Medline. - DOI - PMC - PubMed
    1. Newport J. Kirschner M. A major developmental transition in early Xenopus embryos: I. characterization and timing of cellular changes at the midblastula stage. Cell. 1982;30:675–686. doi: 10.1016/0092-86748290272-0Medline. - DOI - PubMed
    1. Newport J. Kirschner M. A major developmental transition in early Xenopus embryos: II. Control of the onset of transcription. Cell. 1982;30:687–696. doi: 10.1016/0092-86748290273-2Medline. - DOI - PubMed
    1. Heasman J. Patterning the early Xenopus embryo. Development. 2006;133:1205–1217. doi: 10.1242/dev.02304Medline. - DOI - PubMed
    1. Karimi K, Fortriede JD, Lotay VS, Burns KA, Wang DZ, Fisher ME, Pells TJ, James-Zorn C, Wang Y, Ponferrada VG, Chu S, Chaturvedi P, Zorn AM, Vize PD. Xenbase: A genomic, epigenomic and transcriptomic model organism database. Nucleic Acids Res. 2018;46:D861–D868. Medline. - PMC - PubMed

Publication types

MeSH terms

Substances