. 2018 Jun 1;360(6392):981-987.
doi: 10.1126/science.aar4362. Epub 2018 Apr 26.

Single-cell mapping of gene expression landscapes and lineage in the zebrafish embryo

Affiliations

Single-cell mapping of gene expression landscapes and lineage in the zebrafish embryo

Daniel E Wagner et al. Science. .

Abstract

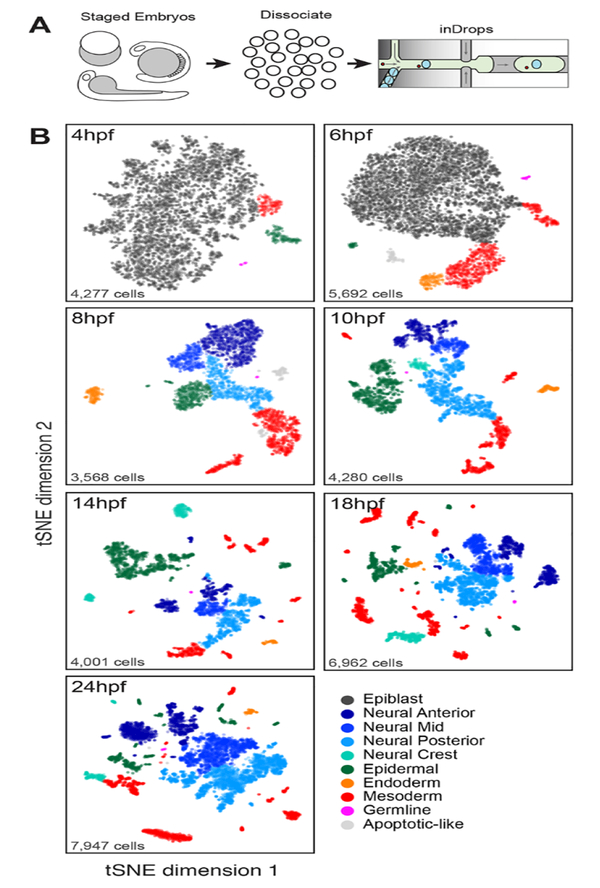
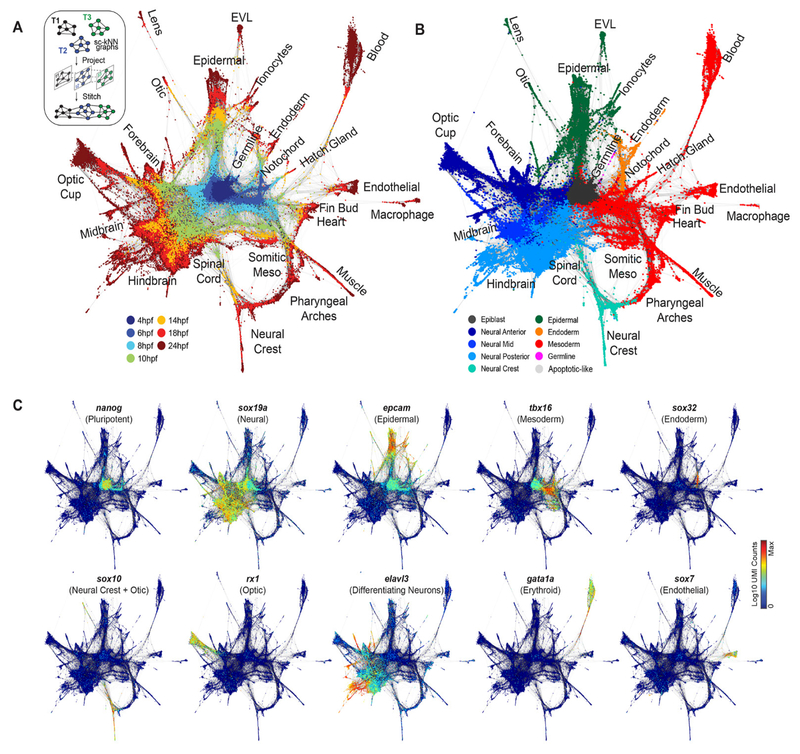
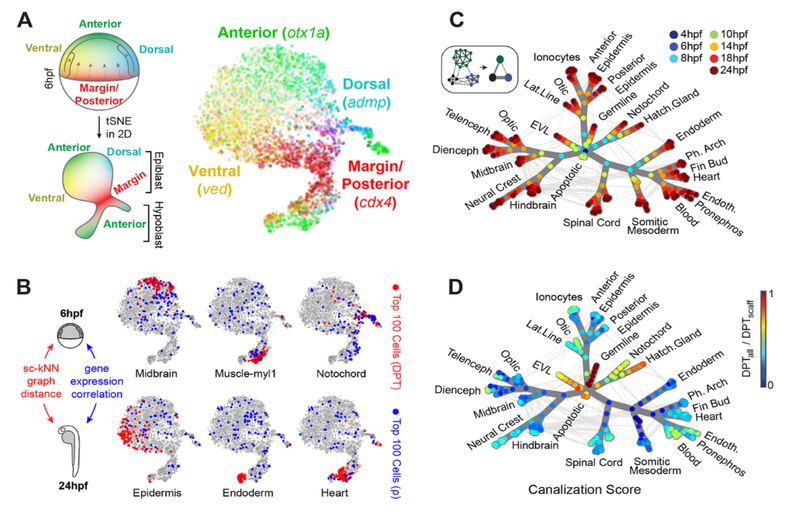
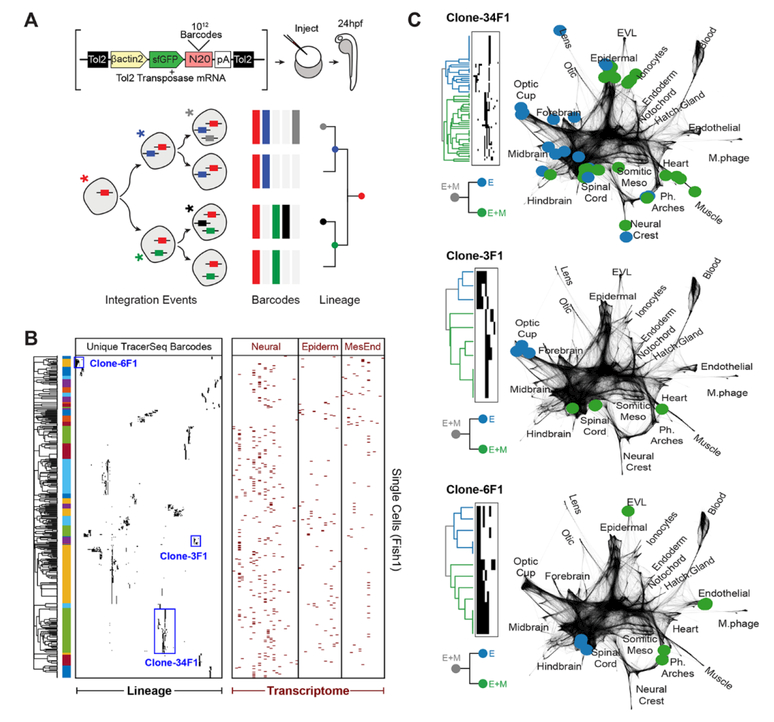
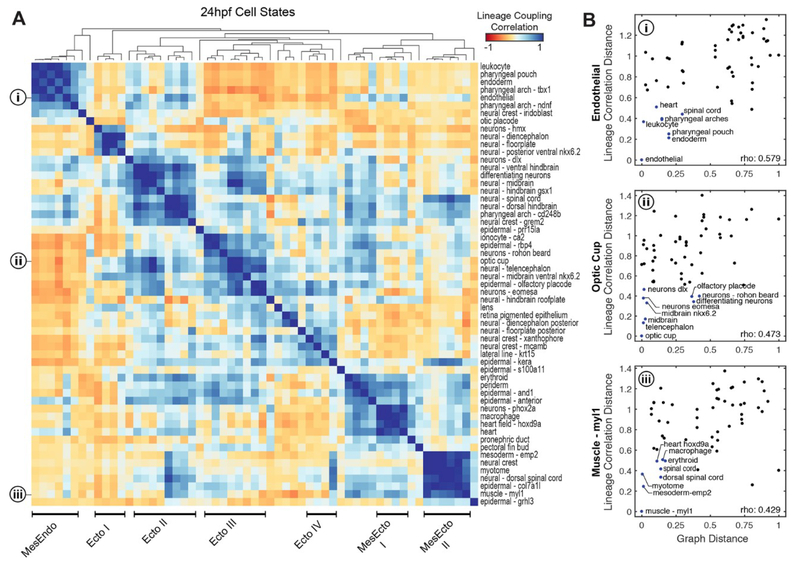
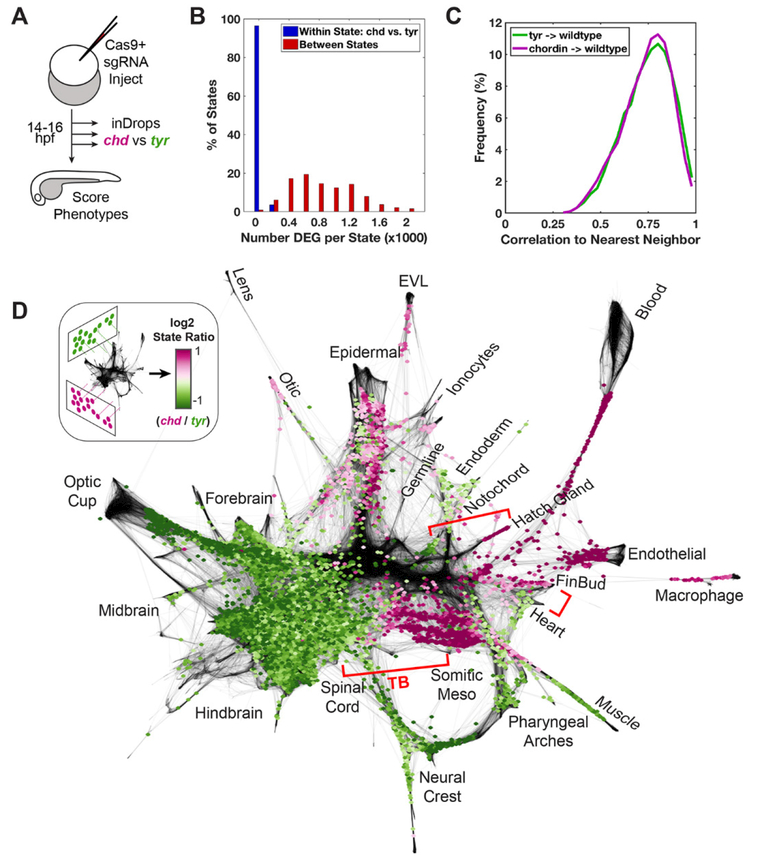
High-throughput mapping of cellular differentiation hierarchies from single-cell data promises to empower systematic interrogations of vertebrate development and disease. Here we applied single-cell RNA sequencing to >92,000 cells from zebrafish embryos during the first day of development. Using a graph-based approach, we mapped a cell-state landscape that describes axis patterning, germ layer formation, and organogenesis. We tested how clonally related cells traverse this landscape by developing a transposon-based barcoding approach (TracerSeq) for reconstructing single-cell lineage histories. Clonally related cells were often restricted by the state landscape, including a case in which two independent lineages converge on similar fates. Cell fates remained restricted to this landscape in embryos lacking the chordin gene. We provide web-based resources for further analysis of the single-cell data.


Conflict of interest statement

Competing interests: S.G.M. D.E.W, C.W., Z.M.C., J.A.B.: none declared. AMK is a founder of 1Cell-Bio, Inc.

Figures

Fig. 1.
Fig. 1.. A single-cell transcriptional atlas of the zebrafish embryo.
(A) Experimental workflow: Single-cell suspensions were dissociated from staged zebrafish embryos and introduced into the inDrops microfluidic device. Single-cell transcriptome libraries were prepared and sequenced by RNA-seq. (B) tSNE maps for each timepoint, constructed in dimensionality-reduced PCA subspace defined by highly co-variable genes (see methods). Cells are colored by germ layer identities inferred from expressed marker genes (see also fig. S2A and table S2).
Fig. 2.
Fig. 2.. Single-cell graph reveals a continuous developmental landscape of cell states.
(A) Overview of graph construction strategy, and a force-directed layout of the resulting single-cell graph (nodes colored by collection timepoint). For each cell, up to 20 within- or between-timepoint mutual nearest neighbor edges are retained. (B) Single-cell graph, colored by germ layer identities inferred from differentially expressed marker genes (see table S2). (C) Single-cell graphs, colored by log10 expression counts for indicated cell type-specific marker genes.
Fig. 3.
Fig. 3.. Single-cell and coarse-grained graphs encode progenitor-fate relationships.
(A) tSNE map of 6hpf epiblast and hypoblast states, colored by normalized transcript counts for select positional marker genes. Overlapping color gradients demonstrate continuous expression domains defined by position. Diagram relates positions of cells in the tSNE map to theoretical positions in the embryo. (B) In silico fate predictions for 6hpf embryo cells. The top 100 cells with predicted 24hpf fate outcomes are indicated for shortest graph diffusion distances (red) or direct single-cell gene expression correlation distances (blue) between 6hpf cells and 24hpf cluster centroids. (C) Construction and overview of the coarse-grained graph (see also fig. S5). Nodes indicate states (groups of transcriptionally similar cells), colored by timepoint. Weighted edges connect similar states within or between timepoints. Spanning tree edges connecting each node to the 4hpf root state through the top weighted edges are highlighted in dark grey. (D) Coarse-grained graph nodes are colored by a “canalization” score, defined as the ratio of diffusion distances between each node and the 4hpf root node through state tree edges only vs. through all graph edges. Highly canalized regions of the graph correspond to branches with the fewest off-tree edges.
Fig. 4.
Fig. 4.. Single-cell transcriptomic barcoding of cell lineages using TracerSeq.
(A) Method overview. (B) Clustered heatmap for 1/5 TracerSeq embryos (see also fig. S9, A to D) displaying lineage and transcriptome information for each cell. Heatmap rows are single cells for which both transcriptome and >1 TracerSeq barcodes were recovered. Columns denote unique TracerSeq barcodes (left, black squares: ≥1 UMI) and tissue identities (right, red squares) inferred from cluster annotations (table S2). Heatmaps were clustered using Jaccard similarity and average linkage. (C) Examples of TracerSeq founder clones with positions of constituent cells (colored nodes) overlaid on the single-cell graph. Graph edges are shown in dark grey. Colors indicate the first lineage bifurcation within each founder clone. In the three cases shown, the founder clone included cells that differentiated into both ectodermal and mesodermal states, while one of the two first subclones was restricted to ectoderm.
Fig. 5.
Fig. 5.. TracerSeq reveals systematic relationships between cell lineage and cell state.
(A) Heatmap of TracerSeq lineage coupling scores (see methods) between pairs of 24hpf states, clustered by correlation distance and average linkage. Groups of states with similar lineage coupling signatures are annotated. (B) Quantitative relationships between lineage coupling correlation distances and scaled state tree diffusion distances for (i) endothelial, (ii) optic cup, and (iii) myl+ muscle states (see also fig. S10, A to F).
Fig. 6.
Fig. 6.. Regulatory features of the developmental landscape identified by genetic perturbation
(A) Left: Overview of the CRISPR experiment. Three pairs of chordin and tyrosinase (control) targeted samples were prepared and processed by inDrops ~14–16hpf. (B) Histogram depicting numbers of differentially expressed genes (DEG) identified in chordin vs. control (tyrosinase) cells for each state (blue bars), compared to DEG numbers when comparing between all state pairs (red bars). DEG were identified by Wilcoxon rank-sum test (adj. p-value < 0.01, absolute log2 fold change >1, average expression >25 transcripts per million). (C) Histogram of Pearson correlation similarities (after PCA-projection) between each chordin/tyrosinase cell and its nearest neighbor from 10hpf, 14hpf, and 18hpf wild-type datasets (see methods). (D) Log2 ratios of cell states with significant differential abundance (FDR < 0.25) in the chordin vs. tyrosinase samples. Purple and green regions correspond to wild-type cell states that are over- or under-represented in the chordin mutant, respectively. Adjacent graph domains with opposing chordin sensitivity are highlighted by brackets. TB: tailbud region (see cdx4 expression in fig. S3).

Comment in

Similar articles

Cited by

References

    1. Schier AF, Talbot WS, Molecular genetics of axis formation in zebrafish. Annu. Rev. Genet 39, 561–613 (2005). doi:10.1146/annurev.genet.37.110801.14375210.1146/annurev.genet.37.110801.143752MedlineMedline - DOI - PubMed
    1. Hashimshony T, Senderovich N, Avital G, Klochendler A, de Leeuw Y, Anavy L, Gennert D, Li S, Livak KJ, Rozenblatt-Rosen O, Dor Y, Regev A, Yanai I, CEL-Seq2: Sensitive highly-multiplexed single-cell RNA-Seq. Genome Biol. 17, 77 (2016). doi:10.1186/s13059-016-0938-810.1186/s13059-016-0938-8MedlineMedline - DOI - PMC - PubMed
    1. Islam S, Zeisel A, Joost S, La Manno G, Zajac P, Kasper M, Lönnerberg P, Linnarsson S, Quantitative single-cell RNA-seq with unique molecular identifiers. Nat. Methods 11, 163–166 (2014). doi:10.1038/nmeth.277210.1038/nmeth.2772MedlineMedline - DOI - PubMed
    1. Klein AM, Mazutis L, Akartuna I, Tallapragada N, Veres A, Li V, Peshkin L, Weitz DA, Kirschner MW, Droplet barcoding for single-cell transcriptomics applied to embryonic stem cells. Cell 161, 1187–1201 (2015). doi:10.1016/j.cell.2015.04.04410.1016/j.cell.2015.04.044MedlineMedline - DOI - PMC - PubMed
    1. Macosko EZ, Basu A, Satija R, Nemesh J, Shekhar K, Goldman M, Tirosh I, Bialas AR, Kamitaki N, Martersteck EM, Trombetta JJ, Weitz DA, Sanes JR, Shalek AK, Regev A, McCarroll SA, Highly parallel genome-wide expression profiling of individual cells using nanoliter droplets. Cell 161, 1202–1214 (2015). doi:10.1016/j.cell.2015.05.00210.1016/j.cell.2015.05.002MedlineMedline - DOI - PMC - PubMed

Publication types

MeSH terms