. 2018 Apr 27;360(6387):423-427.
doi: 10.1126/science.aar5839.

Quantitative mass imaging of single biological macromolecules

Affiliations

Quantitative mass imaging of single biological macromolecules

Gavin Young et al. Science. .

Abstract

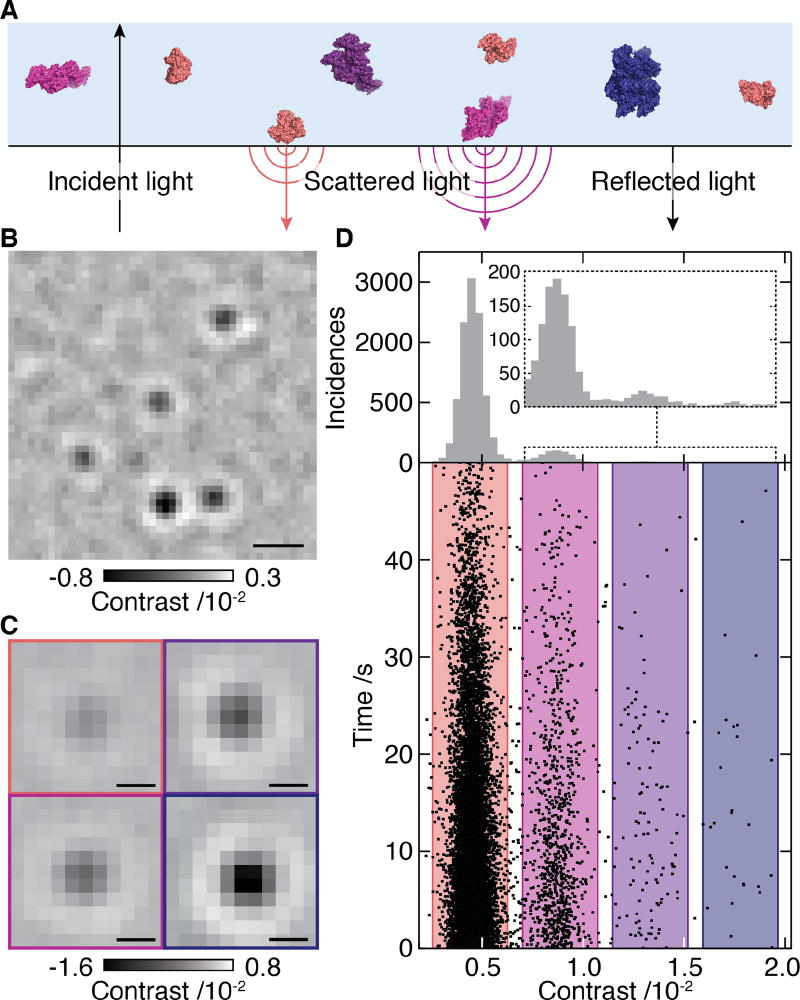
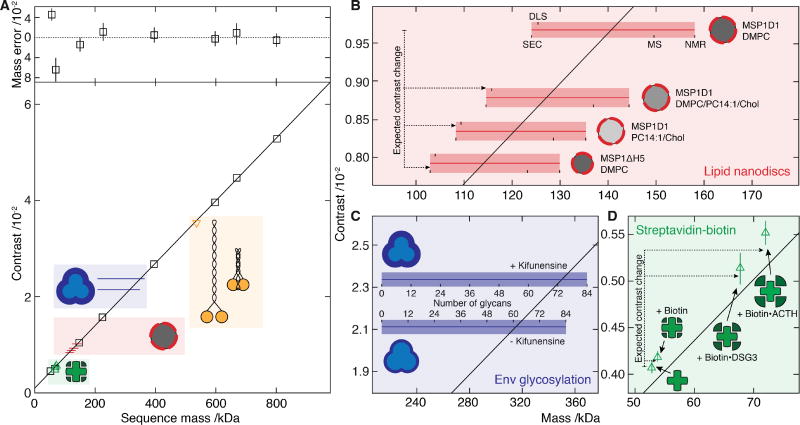
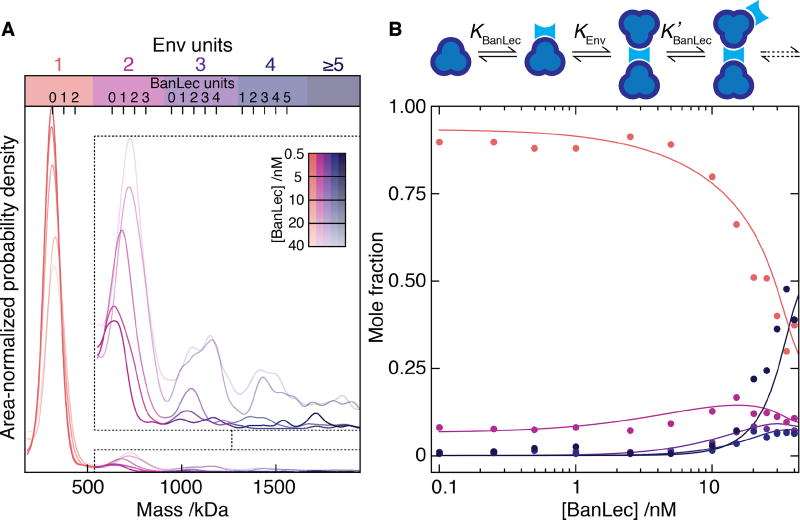
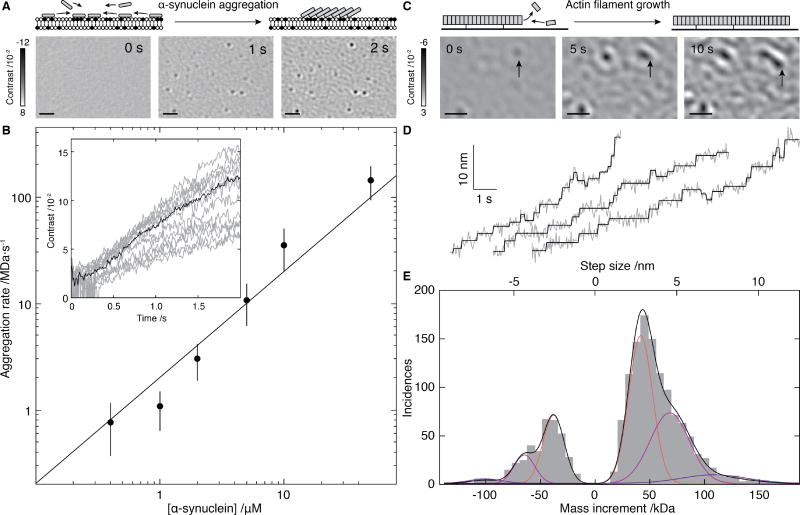
The cellular processes underpinning life are orchestrated by proteins and their interactions. The associated structural and dynamic heterogeneity, despite being key to function, poses a fundamental challenge to existing analytical and structural methodologies. We used interferometric scattering microscopy to quantify the mass of single biomolecules in solution with 2% sequence mass accuracy, up to 19-kilodalton resolution, and 1-kilodalton precision. We resolved oligomeric distributions at high dynamic range, detected small-molecule binding, and mass-imaged proteins with associated lipids and sugars. These capabilities enabled us to characterize the molecular dynamics of processes as diverse as glycoprotein cross-linking, amyloidogenic protein aggregation, and actin polymerization. Interferometric scattering mass spectrometry allows spatiotemporally resolved measurement of a broad range of biomolecular interactions, one molecule at a time.


Conflict of interest statement

All other authors declare no competing interests.

Figures

Fig. 1
Fig. 1. Concept of interferometric scattering mass spectrometry (iSCAMS)
(A) Schematic of the experimental approach relying on immobilization of individual molecules near a refractive index interface. Oligomeric states are coloured differently for clarity (B) Differential interferometric scattering image of BSA. Scale bar: 0.5 µm. (C) Representative images of monomers, dimers, trimers and tetramers of BSA. Scale bar: 200 nm. (D) Scatter plot of single molecule binding events and their scattering contrasts for 12 nM BSA from 14 movies (lower). Corresponding histogram (N=12209) and zoom of the region for larger species (upper). The reduction in landing rate results from a drop in BSA concentration with time due to the large surface-to-volume ratio of our sample cell (see Supplementary Information).
Fig. 2
Fig. 2. Characterization of iSCAMS accuracy, precision, and dependence on molecular shape and identity
(A) Contrast vs molecular mass including proteins used for mass calibration (black), and characterization of shape dependence (yellow), protein-ligand binding (green), lipid nanodisc composition (red) and glycosylation (blue). Mass error (upper panel) is given as a percentage of the sequence mass relative to the given linear fit. (B) Nanodisc mass-measurement for different lipid compositions and protein belts. Masses obtained by alternative methodologies for MSP1D1/DMPC are marked and extrapolated to the other compositions. The horizontal bars indicate the expected mass range as a function of characterization technique, with the thin bar indicating the contrast measured, and the thick bar representative of the measurement uncertainty in terms of the standard error of the mean for repeated experiments. For each sample, the upper text denotes the membrane scaffold protein (MSP) used, and the lower the lipids in the nanodisc. (C) Recorded differential contrast for Env expressed in the presence or absence of kifunensine, and associated mass ranges expected for different glycosylation levels as defined for C. (D) Mass-sensitive detection of ligand binding using the biotin-streptavidin system according to the sequence mass of streptavidin and the masses of biotin and two biotinylated peptides relative to the calibration obtained from A. Abbreviations used are summarized in Supplementary Table S8.
Fig. 3
Fig. 3. Single molecule mass analysis of heterogeneous protein assembly
(A) Mass distributions for Env in the presence of 0.5 – 40 nM BanLec monomer. Inset: zoom alongside expected positions for multiples of bound BanLec tetramers. (B) Oligomeric fractions colored according to A vs BanLec concentration including predictions (solid) using the given cooperative model.
Fig. 4
Fig. 4. Mass-imaging of mesoscopic dynamics
(A) Schematic of and iSCAMS images for α-synuclein (1 µM) aggregation on a negatively charged bilayer membrane. (B) Initial growth rate vs. α-synuclein concentration alongside the best fit assuming first order kinetics (solid). Inset: Individual growth trajectories (grey) and average (black) for 21 particles from A. (C) Schematic and iSCAMS images of actin polymerization. The arrow highlights a growing filament. (D) Representative traces of actin filament tip position (grey) and corresponding detected steps (black). (E) Step and mass histogram from 1523 steps and 33 filaments including a fit to a Gaussian mixture model (black) and individual contributions (colored). Scale bars: 1 µm. In these experiments, background correction involved removal of the static background prior to acquisition, rather than continuous differential imaging as in Figs. 2 and 3 (see Supplementary Information).

Comment in

  • Weighing one protein with light.
    Lee SF, Klenerman D. Lee SF, et al. Science. 2018 Apr 27;360(6387):378-379. doi: 10.1126/science.aat5851. Science. 2018. PMID: 29700252 No abstract available.

References

    1. Ahnert SE, Marsh JA, Hernandez H, Robinson CV, Teichmann SA. Principles of assembly reveal a periodic table of protein complexes. Science. 2015;350:aaa2245. - PubMed
    1. Rottner K, Faix J, Bogdan S, Linder S, Kerkhoff E. Actin assembly mechanisms at a glance. J. Cell Sci. 2017;130:3427–3435. - PubMed
    1. Hemmat M, Castle BT, Odde DJ. Microtubule dynamics: moving toward a multi-scale approach. Curr. Opin. Cell Biol. 2018;50:8–13. - PMC - PubMed
    1. Wang H-W, Wang J-W. How cryo-electron microscopy and X-ray crystallography complement each other. Protein Sci. 2017;26:32–39. - PMC - PubMed
    1. Kanno DM, Levitus M. Protein Oligomerization Equilibria and Kinetics Investigated by Fluorescence Correlation Spectroscopy: A Mathematical Treatment. J. Phys. Chem. B. 2014;118:12404–12415. - PubMed

Publication types