. 2018 Apr 27;8(1):94.
doi: 10.1038/s41398-018-0142-6.

Brain region-specific disruption of Shank3 in mice reveals a dissociation for cortical and striatal circuits in autism-related behaviors

Affiliations

Brain region-specific disruption of Shank3 in mice reveals a dissociation for cortical and striatal circuits in autism-related behaviors

Alexandra L Bey et al. Transl Psychiatry. .

Abstract

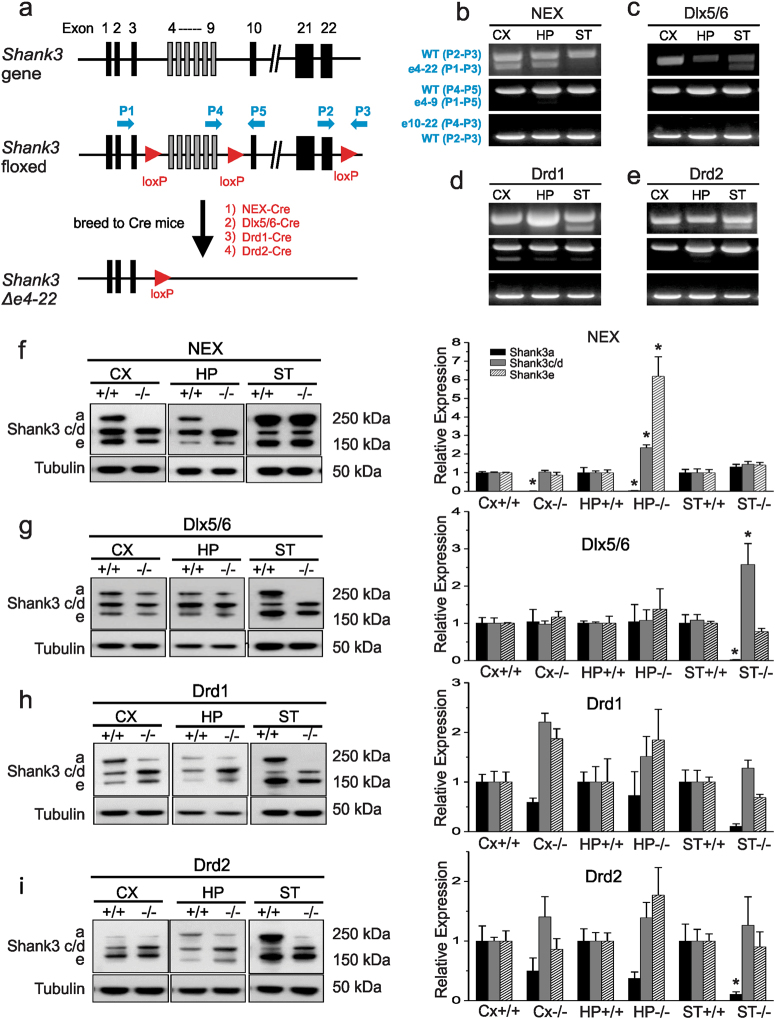
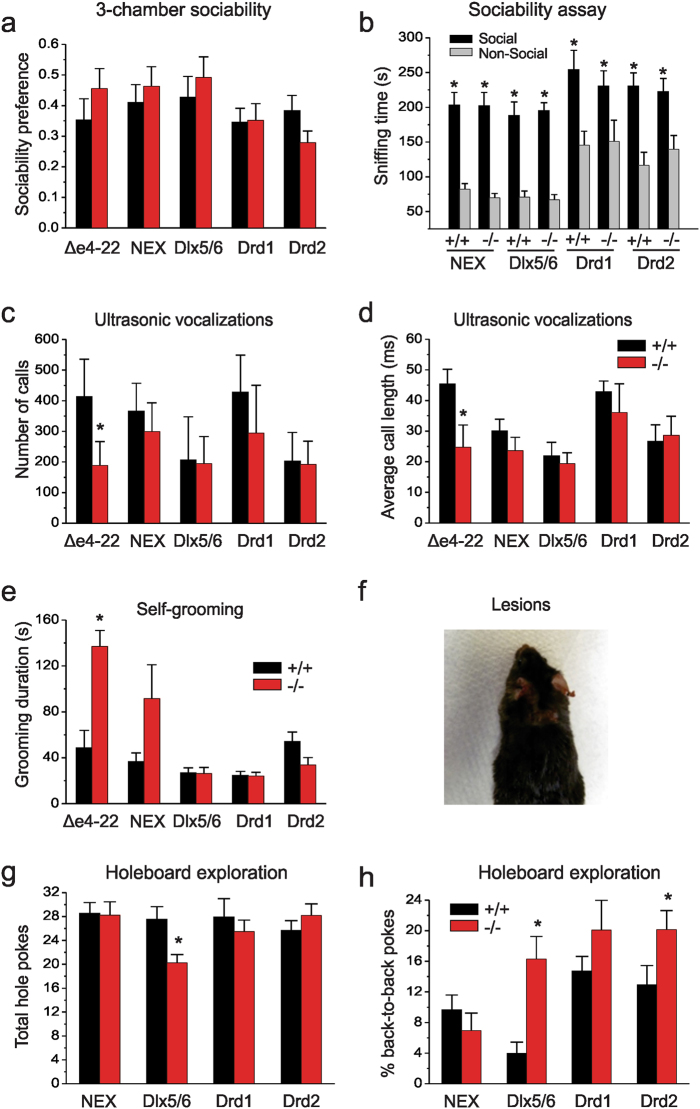
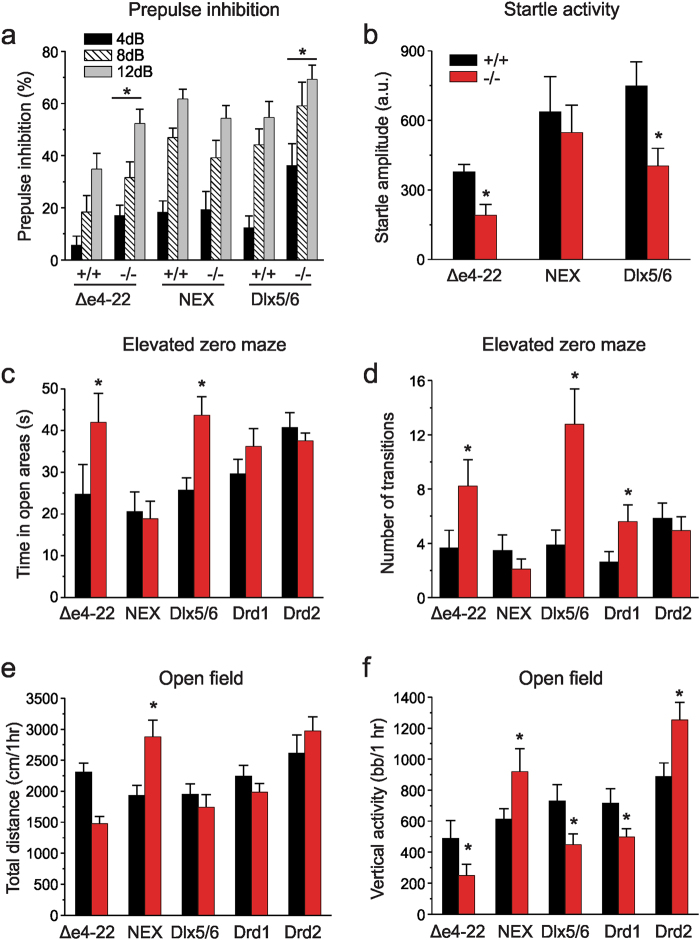
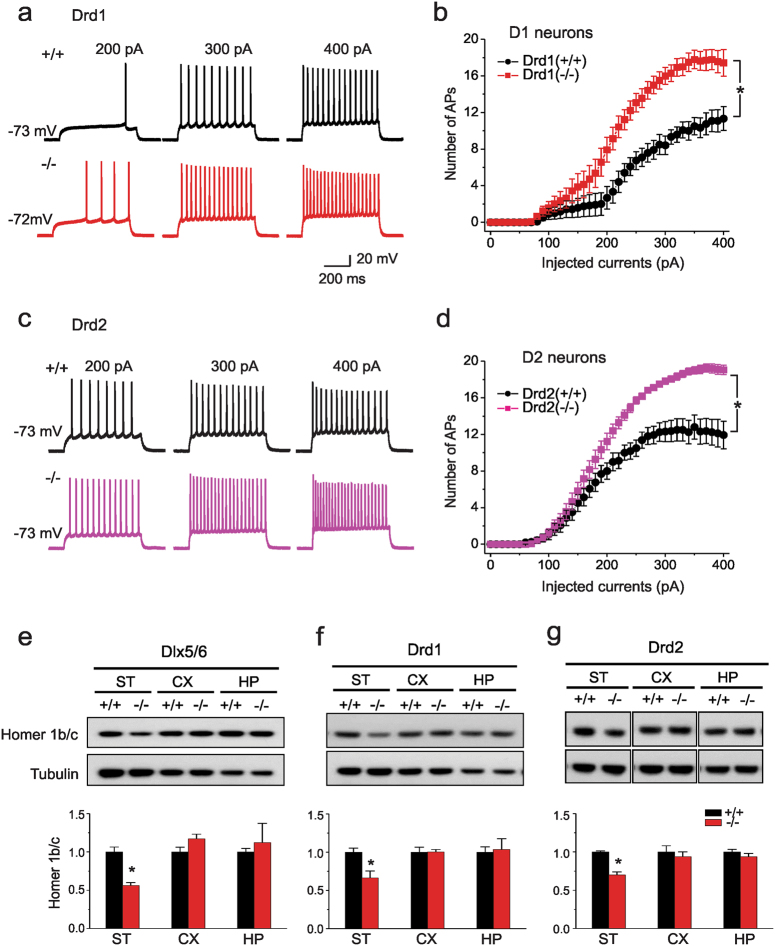
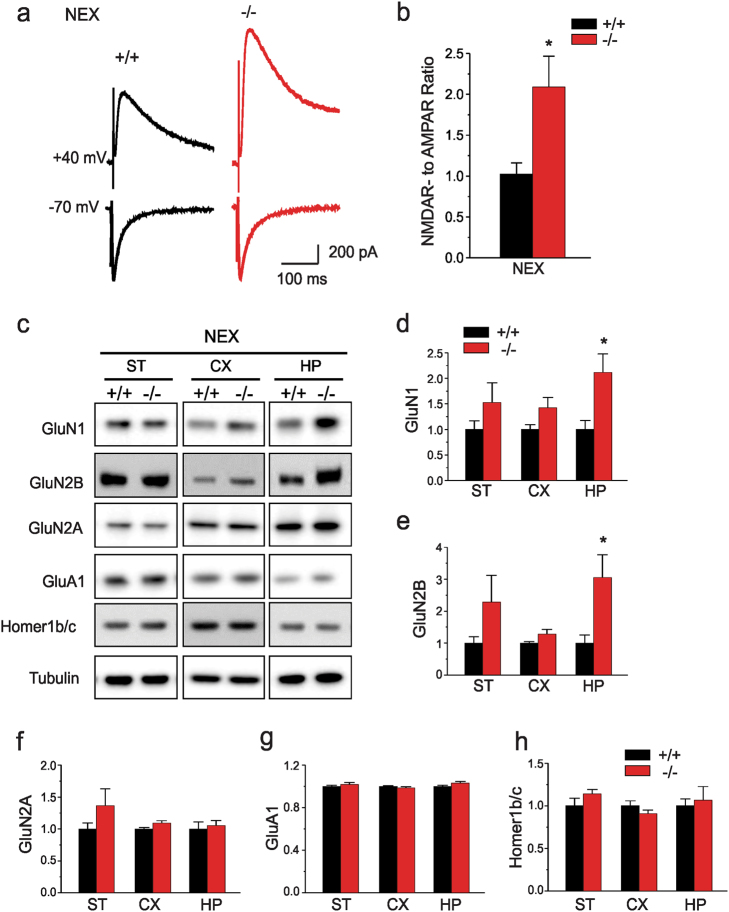
We previously reported a new line of Shank3 mutant mice which led to a complete loss of Shank3 by deleting exons 4-22 (Δe4-22) globally. Δe4-22 mice display robust ASD-like behaviors including impaired social interaction and communication, increased stereotypical behavior and excessive grooming, and a profound deficit in instrumental learning. However, the anatomical and neural circuitry underlying these behaviors are unknown. We generated mice with Shank3 selectively deleted in forebrain, striatum, and striatal D1 and D2 cells. These mice were used to interrogate the circuit/brain-region and cell-type specific role of Shank3 in the expression of autism-related behaviors. Whole-cell patch recording and biochemical analyses were used to study the synaptic function and molecular changes in specific brain regions. We found perseverative exploratory behaviors in mice with deletion of Shank3 in striatal inhibitory neurons. Conversely, self-grooming induced lesions were observed in mice with deletion of Shank3 in excitatory neurons of forebrain. However, social, communicative, and instrumental learning behaviors were largely unaffected in these mice, unlike what is seen in global Δe4-22 mice. We discovered unique patterns of change for the biochemical and electrophysiological findings in respective brain regions that reflect the complex nature of transcriptional regulation of Shank3. Reductions in Homer1b/c and membrane hyper-excitability were observed in striatal loss of Shank3. By comparison, Shank3 deletion in hippocampal neurons resulted in increased NMDAR-currents and GluN2B-containing NMDARs. These results together suggest that Shank3 may differentially regulate neural circuits that control behavior. Our study supports a dissociation of Shank3 functions in cortical and striatal neurons in ASD-related behaviors, and it illustrates the complexity of neural circuit mechanisms underlying these behaviors.


Conflict of interest statement

The authors declare that they have no conflict of interest.

Figures

Fig. 1
Fig. 1. Conditional Shank3 e4-22flox mice permit brain region-specific excision of Shank3.
a The wild-type mus Shank3 locus (top) depicting the engineered insertion of loxP sites (red arrowheads) before exon 4, after exon 9, and after exon 22 (middle). Crossing the Shank3 e4–22flox/flox mice to Cre mice results in a two-step recombination ultimately at the first and third loxP sites, yielding deletion of Δe4–22 in Cre-expressing cells (bottom). Primers (blue arrows) are shown for detecting recombination of the loxP sites. b–e PCR-based detection of Shank3 deletion of Δe4–22 (p1–p3), Δe4–9 (p1–p5), Δe10–22(p4–p3) in the cortex (CX), hippocampus (HP), and striatum (ST) of NEX-Cre Shank3 floxed mice (NEX) (b), Dlx5/6-Cre Shank3 floxed mice (Dlx5/6) (c), Drd1-Cre Shank3 floxed mice (Drd1) (d), and Drd2-Cre Shank3 floxed mice (Drd2) (e). A prominent deletion of e4–22 was observed in brain regions where corresponding Cres are predominantly expressed. f Western blots of dissected brains from NEX-Shank3 mice reveals a loss of Shank3a protein in CX and HP, but not in ST from crude PSD fractions (two-way ANOVA, main effects of genotype and region and interaction, p ≤ 0.0001); paradoxically, Shank3c/d and Shank3e were increased in the HP (two-way ANOVA, main effects of genotype and region and interaction, p ≤ 0.002); n = 5/region/genotype. g Western blotting of dissected brains from Dlx5/6-Shank3 mice reveals loss of Shank3a protein in the ST but not in the CX or HP crude PSD fractions (two-way ANOVA, main effects of region and interaction, p ≤ 0.05); with a similar paradoxical increase in Shank3c/d in the ST (two-way ANOVA, main effects of genotype and region and interaction, p ≤ 0.04) but no significant change for Shank3e; n = 5/region/genotype. h Western blotting of dissected brains of Drd1-Shank3 mice reveals a loss of Shank3a protein in the ST, but not in the CX or HP crude PSD fractions (two-way ANOVA, main effect of genotype, p-value ≤ 0.02), although this did not withstand Bonferroni-corrected post-hoc comparisons and no significant differences were seen for Shank3c/d or Shank3e; n = 5/region/genotype. i Western blotting of dissected brains of Drd2-Shank3 mice reveals loss of Shank3a protein in the ST but not in the CX or HP crude PSD fractions (two-way ANOVA, main effect of genotype, p-value ≤ 0.01), with no significant differences seen for Shank3c/d or Shank3e; n = 5/region/genotype. fi, *p < 0.05, compared to the+/+control. All data are expressed as means ± SEM and were analyzed by two-way ANOVAs with genotype and brain region as factors; Bonferroni-corrected post-hoc comparisons
Fig. 2
Fig. 2. Repetitive behaviors persist in conditional Shank3 knockout mice while social behavior and ultrasonic communication is intact.
a, b Sociability assay. a All lines of mutant mice show normal social affiliation, preferring to interact with a novel mouse over that of an inanimate object when corrected for total time spent with either stimuli; t-tests, n = 9–16/genotype. b All lines showed significant increases in sniffing time of the social over the non-social stimuli (RMANOVA, main effects of stimulus, p-value ≤0.0001) but without genotype-related distinctions; n = 9–16/genotype. c While global Δe4−22 mice emit fewer USVs (p = 0.002), all lines of conditional knockout mice (−/−) emit similar levels of calls as their wild-type controls (+/+); n = 7–16/genotype. d Only global Δe4−22 mice emit USVs of shorter durations (p = 0.001) than their +/+ littermates; n = 7–13/genotype. e Global Shank3 Δe4−22 mice spend more time self-grooming (p = 0.0004), with a trend for NEX-Shank3 mice (p = 0.086), whereas no genotype differences were found for any of the other lines of mutant mice; n = 11–18/genotype. f Approximately 25% (4/15) of the NEX-Shank3 mice self-groomed to the point of producing self-injurious skin lesions, χ2(n = 30, df = 1) = 4.615, p = 0.032; n = 15/genotype. g In the hole-board test, Dlx5/6-Shank3 knockout (−/−) mice made fewer nose-pokes (p ≤ 0.04) than their respective +/+ controls, whereas no differences were seen in the other lines of mice; t-tests, n = 11–18/genotype. h Dlx5/6-Shank3 (p = 0.001) and Drd2-Shank3 mice (p = 0.050) made more repetitive nose pokes into single holes than +/+ mice; neither Drd1-Shank3 nor NEX-Shank3 mice showed this tendency; t-tests, n = 11–18/genotype. For all panels, *p < 0.05, compared to the +/+ control. All data are expressed as means ± SEM and were analyzed by independent samples two-tailed t-tests unless otherwise specified
Fig. 3
Fig. 3. Distinctions among the Shank3 conditional mice in anxiety-like behaviors and motor performance.
a Prepulse inhibition (PPI) where genotypes within each strain were analyzed separately. While all mice showed increased PPI with increasing prepulse intensity (RMANOVA, main effect of intensity, p ≤ 0.001) global Δe4−22 and Dlx5/6-Shank3 mutant mice showed enhanced PPI across various intensities of prepulse stimuli relative to their +/+ controls (main effect of genotype, p 0.05). No genotype differences were seen in NEX-Shank3 mice; n = 9–12/genotype. b Startle activities in global Δe4−22 and Dlx5/6-Shank3 (t-tests, p ≤ 0.02) were reduced relative to their +/+ littermates, whereas startle amplitudes in NEX-Shank3 mice were similar to those of their +/+ littermates; n = 9–12/genotype. c, d Elevated zero maze for anxiety-like behaviors. c Similar to the global Δe4−22 mice, Dlx5/6-Shank3 mice spend more time in the open areas of the maze than their +/+ controls (t-tests, p ≤ 0.05); n = 9–18/genotype. Responses in the NEX-Shank3, Drd1-Shank3, Drd2-Shank3 were similar to those of their +/+ controls. d Dlx5/6-Shank3 (t-test, p = 0.006) and Drd1-Shank3 (t-test, p = 0.050) mice also make more transitions from the closed-to-open-to-closed areas, as is seen in global Δe4−22 mice (t-test, p = 0.008); n = 9–19/genotype. e, f Open field activity. e Global Δe4−22 mice traveled over a shorter distance in the open field (t-test, p = 0.056), whereas locomotion in NEX-Shank3 mice was greater than that of their +/+ littermates (t-test, p = 0.004). No significant differences in locomotion were seen in Dlx5/6-Shank3, Drd1-Shank3, or Drd2-Shank3 mice; n = 12–18/genotype. f Dlx5/6-Shank3 (t-test, p = 0.038) Drd1-Shank3 (t-test, p = 0.050), and global Δe4−22 mice (t-test, p = 0.010) mice all demonstrated lower rearing behavior. By contrast, NEX-Shank3 (t-test, p = 0.025) and Drd2-Shank3 mice (t-test, p = 0.015) demonstrated increased rearing; n = 12–18/genotype; bb/ 1 h = beam breaks in 1 h. For all panels, *p < 0.05, compared to wild-type controls. All data are expressed as means ± SEM and were analyzed by independent samples two-tailed t-tests unless otherwise specified
Fig. 4
Fig. 4. Loss of Shank3 in selected striatal neurons leads to cell autonomous alterations of synaptic function and PSD components.
(a) Representative traces of evoked action potentials in D1 MSNs neurons from Drd1-Shank3 WT (+/+) (black) and KO (−/−) (red) mice. The action potentials reflect responses to 200, 300, and 400 pA current injections, respectively. b Summarized data for the number of evoked action potentials (APs) at the indicated amplitudes of current injection in D1 MSNs from Drd1-Shank3 WT (+/+) and KO (−/−) mice (2-way ANOVA, main effects of genotype and stimulation, p < 0.001, genotype x stimulation interaction, p < 0.001). c Example traces of evoked action potentials in D2 MSNs neurons from Drd2-Shank3 WT (+/+) (gray) and KO (−/−) (pink) mice. d Summarized data for the numbers of evoked action potentials at the indicated amplitudes of current injection in D2 MSNs from Drd2-Shank3 WT (+/+) and KO (−/−) mice (2-way ANOVA, main effects of genotype and stimulation, p < 0.001, genotype x stimulation interaction, p < 0.001). eg Homer1b/c levels in the PSD from striatum where loss of Shank3 was targeted. (e) Dlx5/6-Shank3 mice show a reduction in Homer1b/c protein in striatal (ST) (p = 0.002), but not in cortical (CX) or hippocampal (HP) PSD samples; n = 5 mice/genotype. f Drd1-Shank3 mice have decreased Homer 1b/c in ST (p = 0.018), but not in the CX or HP samples; n = 4 mice/genotype. g Drd2-Shank3 mice have a loss of Homer1b/c in the ST (p < 0.001), but not in the CX or HP; n = 4 mice/genotype. For all westerns, independent samples two-tailed t-tests; representative images are shown and each western was replicated at least two times. For all panels, *p < 0.05, compared to wild-type controls. All data are expressed as means ± SEM
Fig. 5
Fig. 5. Loss of Shank3 in hippocampal neurons leads to increased NMDA synaptic function and alterations in receptor subunits.
a Representative traces of NMDAR-EPSCs and AMPAR-EPSCs recorded at the same stimulation intensities (300 µA) and in the same CA1 neurons from NEX-Shank3 WT (+/+) and KO (−/−) mice. b Bar graph of the NMDAR- to AMPAR-EPSC ratio in NEX-Shank3 WT (+/+) and KO (−/−) mice (t-test; *p = 0.009). c Immunoblotting of PSD components from striatum (ST), cortex (CX), and hippocampus (HP) of NEX-Shank3 mice. d NEX-Shank3 mice have increased GluN1 protein in the CX (t-test; p = 0.059) and HP (t-test; p = 0.019), but not in the ST. e Samples from these mice also have augmented GluN2B protein in the HP (p = 0.022), with a tendency for increased levels in the CX (t-test; p = 0.102), but not in the ST. fh GluN2A (f), GluA1 (g), and Homer1b/c (h) did not show any significant changes between NEX-Shank3 mice and WT littermates in any of the brain regions. n = 6 mice/genotype for all westerns; representative images shown and each western was replicated at least two times. For all panels, independent samples two-tailed t-tests; *p < 0.05, from +/+. All data are expressed as means ± SEM

References

    1. American Psychiatric Association. Diagnostic and statistical manual of mental disorders. 5th edn. Arlington, VA: American Psychiatric Publishing; 2013.
    1. Autism Developmental Disabilities Monitoring Network. Prevalence of autism spectrum disorders--Autism and Developmental Disabilities Monitoring Network, 14 sites, United States, 2008. MMWR Surveill. Summ. 2012;61:1–19. - PubMed
    1. DiCicco-Bloom E, et al. The developmental neurobiology of autism spectrum disorder. J. Neurosci. 2006;26:6897–6906. doi: 10.1523/JNEUROSCI.1712-06.2006. - DOI - PMC - PubMed
    1. Langen M, et al. Changes in the developmental trajectories of striatum in autism. Biol. Psychiatry. 2009;66:327–333. doi: 10.1016/j.biopsych.2009.03.017. - DOI - PubMed
    1. Courchesne E, Pierce K. Why the frontal cortex in autism might be talking only to itself: local over-connectivity but long-distance disconnection. Curr. Opin. Neurobiol. 2005;15:225–230. doi: 10.1016/j.conb.2005.03.001. - DOI - PubMed

Publication types

MeSH terms