. 2018 Apr 26;8(1):6564.
doi: 10.1038/s41598-018-25019-1.

A Temporal Examination of Platelet Counts as a Predictor of Prognosis in Lung, Prostate, and Colon Cancer Patients

Affiliations

A Temporal Examination of Platelet Counts as a Predictor of Prognosis in Lung, Prostate, and Colon Cancer Patients

Joanna L Sylman et al. Sci Rep. .

Abstract

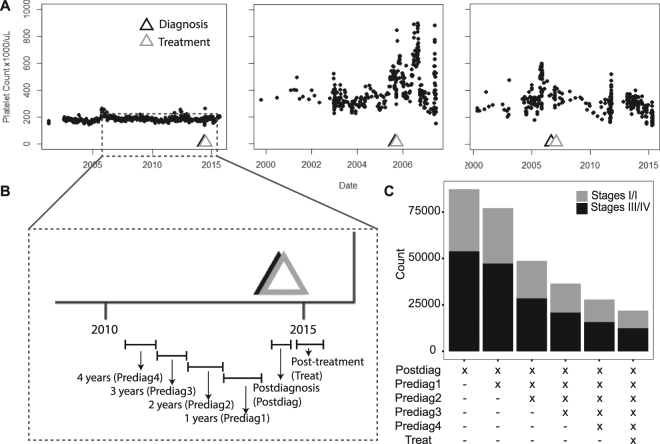
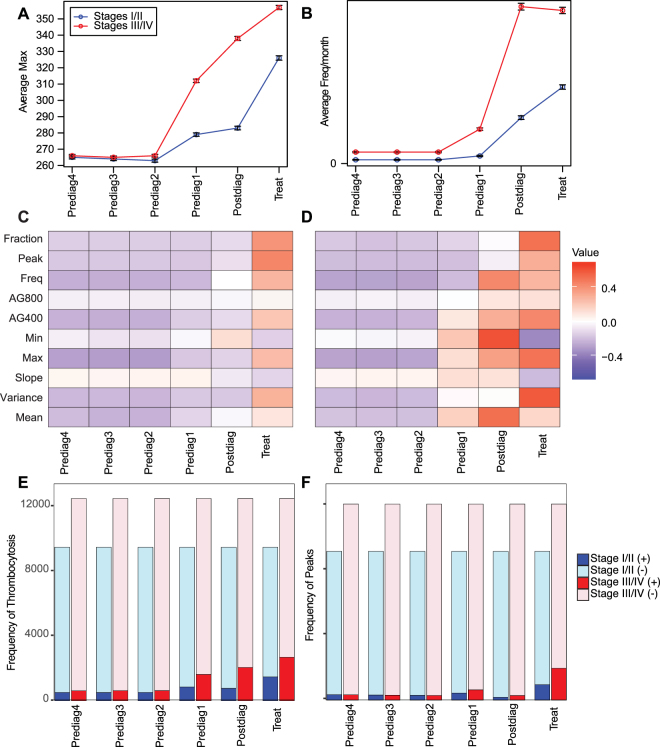
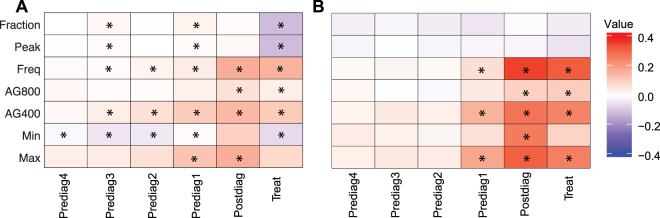
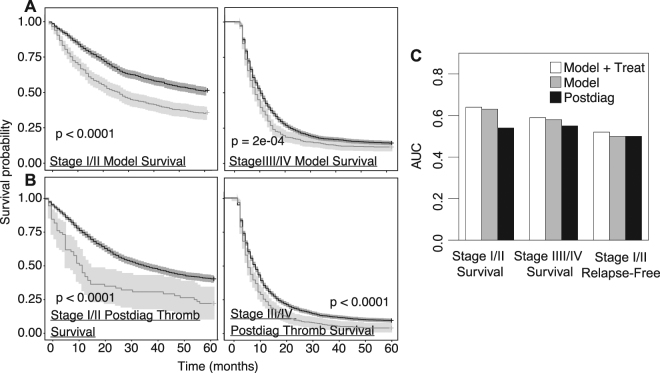
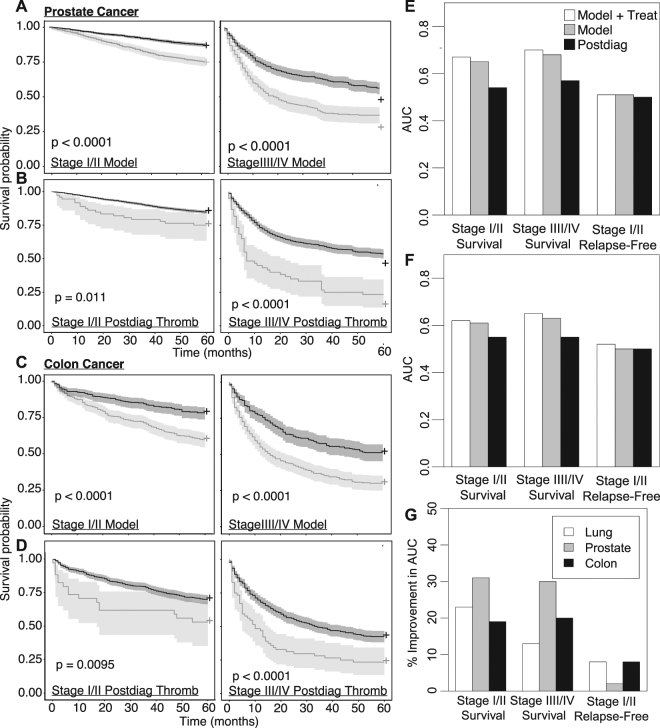
Platelets, components of hemostasis, when present in excess (>400 K/μL, thrombocytosis) have also been associated with worse outcomes in lung, ovarian, breast, renal, and colorectal cancer patients. Associations between thrombocytosis and cancer outcomes have been made mostly from single-time-point studies, often at the time of diagnosis. Using laboratory data from the Department of Veterans Affairs (VA), we examined the potential benefits of using longitudinal platelet counts in improving patient prognosis predictions. Ten features (summary statistics and engineered features) were derived to describe the platelet counts of 10,000+ VA lung, prostate, and colon cancer patients and incorporated into an age-adjusted LASSO regression analysis to determine feature importance, and predict overall or relapse-free survival, which was compared to the previously used approach of monitoring for thrombocytosis near diagnosis (Postdiag AG400 model). Temporal features describing acute platelet count increases/decreases were found to be important in cancer survival and relapse-survival that helped stratify good and bad outcomes of cancer patient groups. Predictions of overall and relapse-free survival were improved by up to 30% compared to the Postdiag AG400 model. Our study indicates the association of temporally derived platelet count features with a patients' prognosis predictions.


Conflict of interest statement

The authors declare no competing interests.

Figures

Figure 1
Figure 1
(A) Example temporal platelet count information of three patients with annotation of the date of diagnosis and primary treatment. (B) Each of the patient’s lab count information is discretized into the following time periods which include Prediag4, Prediag3, Prediag2, Prediag1, Postdiag and Treat, which are respectively fourth, third, second and first year time periods prior to the date of diagnosis, the time interval between the date of diagnosis and the date of the first intervention, and a three-month period following the intervention. (C) The size of the study population after incorporating more time periods for early and late stage lung cancer patients.
Figure 2
Figure 2
The temporal variations of the features are shown. Averages and standard error of the mean of all of the patients are shown for each of the time periods by stage (Stages I/II – blue, stages III/IV –red) for two example features: (A) Max and (B) Freq. All of the normalized features are shown over time (C,D). The average of each feature for each time interval were centered by calculating a z-score from the overall average or median (non-normal data) and standard deviation of all the time periods for (C) Stages I/II and (D) Stages III/IV patients. Red and blue colors are indicative of features that respectively deviate positively and negatively from an overall average (or median). The quantity of patients with at least one (E) thrombocytosis event or (F) peak occurrence increases at each of the designated time periods.
Figure 3
Figure 3
The differences between the normalized population that survived less than five years versus the patients that survived more than five years in (A) early stage and (B) late stage cancer patients. Red and blue colors are indicative of features that respectively have an increased or decreased signal in the population that survived less than five years compared to the population that survived more than five years. Each of the features within the two population groups were compared using a Wilcoxon Rank-Sum test. Each * is indicative of tests with P-values regarded as having less than a 5% false discovery rate.
Figure 4
Figure 4
Kaplan Meier curves for lung cancer patient survival were either based on (A) LASSO model-derived features with OR > 1.25 or OR < 0.75 in adjusted logistic regression. Positive matches were defined as a patient being in the top 10% (OR > 1.25) or bottom 10% (OR < 0.75) for a continuous feature, and “True” if a binary variable (B) or a True Postdiag AG400. Positive matches are represented in light grey, and negative matches are represented in dark grey. (C) Overall description of the performance of the prediction methods with an AUC metric. The white bars indicate the AUCs obtained in the LASSO Model with the inclusion of the post-treatment data, the grey bar indicates the AUCS obtained with just the LASSO Model, and the black bars indicate the AUCs obtained from just using the Postdiag AG400 model.
Figure 5
Figure 5
Kaplan Meier curves for prostate and colon cancer patient survival were either based on (A,C) LASSO model-derived features with OR > 1.25 or OR < 0.75 in an adjusted logistic regression model. Positive matches were defined as a patient being in the top 10% (OR > 1.25) or bottom 10% (OR < 0.75) for a continuous feature, and “True” if a binary variable or (B,D) a True Postdiag AG400. Positive matches are represented in light grey, and negative matches are represented in dark grey. Overall description of the performance of the two prediction methods with an AUC metric with (E) prostate and (F) colon cancer patients. The white bars indicate the AUCs obtained in the LASSO Model with the inclusion of the Treat data, the grey bar indicates the AUCS obtained with just the LASSO Model, and the black bars indicate the AUCs obtained from just using the Postdiag AG400 model. (G) An overall summary of how the prognosis prediction of early and late survival, and early stage relapse improve by using the LASSO model + Treat instead of the Postdiag AG400 model. These improvements were calculated based on the AUCs obtained with the platelet count features only.

Similar articles

Cited by

References

    1. McCarty OJ, Mousa SA, Bray PF, Konstantopoulos K. Immobilized platelets support human colon carcinoma cell tethering, rolling, and firm adhesion under dynamic flow conditions. Blood. 2000;96:1789–1797. - PubMed
    1. Nieswandt B, Hafner M, Echtenacher B, Männel DN. Lysis of tumor cells by natural killer cells in mice is impeded by platelets. Cancer Res. 1999;59:1295–1300. - PubMed
    1. Kim YJ, Borsig L, Varki NM, Varki A. P-selectin deficiency attenuates tumor growth and metastasis. Proc. Natl. Acad. Sci. USA. 1998;95:9325–9330. doi: 10.1073/pnas.95.16.9325. - DOI - PMC - PubMed
    1. Stone RL, et al. Paraneoplastic Thrombocytosis in Ovarian Cancer. N. Engl. J. Med. 2012;366:610–618. doi: 10.1056/NEJMoa1110352. - DOI - PMC - PubMed
    1. Sylman JL, et al. Platelet count as a predictor of metastasis and venous thromboembolism in patients with cancer. Converg. Sci. Phys. Oncol. 2017;3:23001. doi: 10.1088/2057-1739/aa6c05. - DOI - PMC - PubMed

Publication types

MeSH terms