. 2018 Apr 26;8(1):6578.
doi: 10.1038/s41598-018-24931-w.

Exposure to toxic metals triggers unique responses from the rat gut microbiota

Affiliations

Exposure to toxic metals triggers unique responses from the rat gut microbiota

Joshua B Richardson et al. Sci Rep. .

Abstract

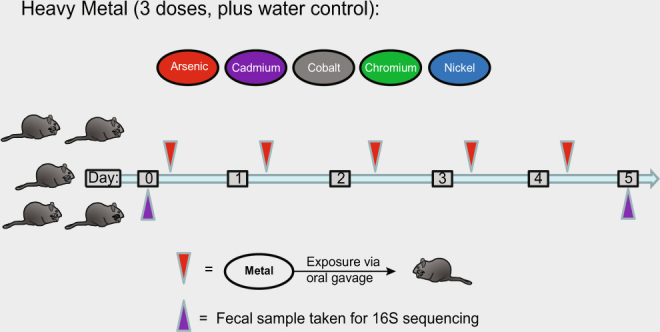
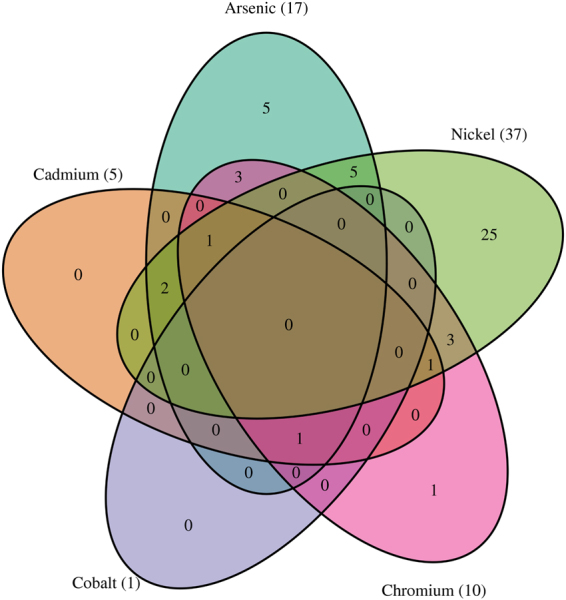
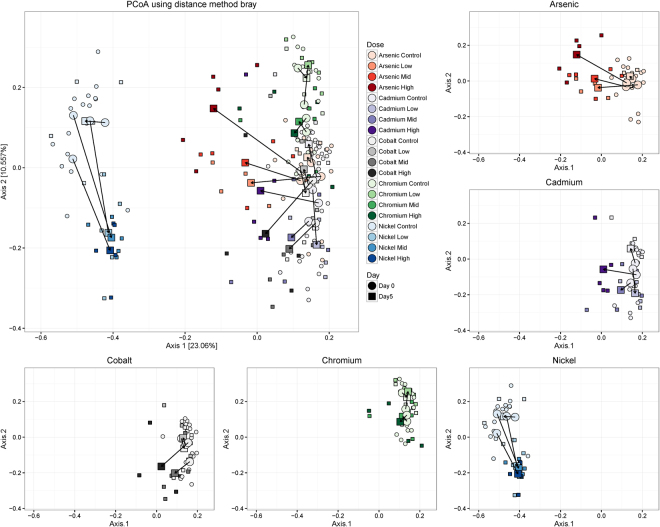
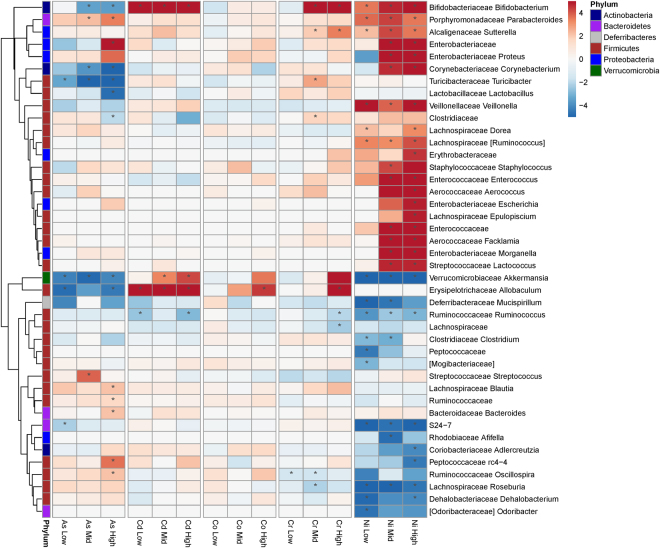
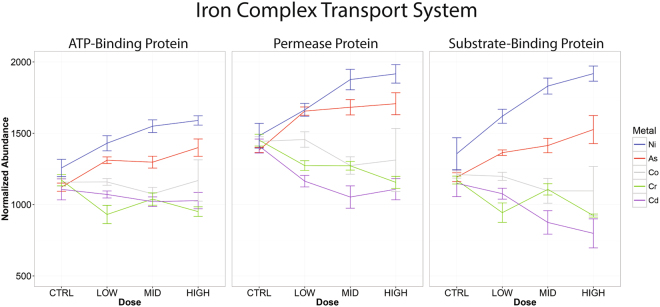
Our understanding of the interaction between the gut microbiota and host health has recently improved dramatically. However, the effects of toxic metal exposure on the gut microbiota remain poorly characterized. As this microbiota creates a critical interface between the external environment and the host's cells, it may play an important role in host outcomes during exposure. We therefore used 16S ribosomal RNA (rRNA) gene sequencing to track changes in the gut microbiota composition of rats exposed to heavy metals. Rats were exposed daily for five days to arsenic, cadmium, cobalt, chromium, nickel, or a vehicle control. Significant changes to microbiota composition were observed in response to high doses of chromium and cobalt, and significant dose-dependent changes were observed in response to arsenic, cadmium and nickel. Many of these perturbations were not uniform across metals. However, bacteria with higher numbers of iron-importing gene orthologs were overly represented after exposure to arsenic and nickel, suggesting some possibility of a shared response. These findings support the utility of the microbiota as a pre-clinical tool for identifying exposures to specific heavy metals. It is also clear that characterizing changes to the functional capabilities of microbiota is critical to understanding responses to metal exposure.


Conflict of interest statement

The authors declare no competing interests.

Figures

Figure 1
Figure 1
Experimental summary. Diagram of dosing and sample schedule. A cohort of 5 rats were exposed to one of the indicated metals at a particular dose for five days, with samples taken before and after the exposures, as shown.
Figure 2
Figure 2
Taxonomic summaries. Stacked bar plots showing the average relative abundance of each taxa at various taxonomic levels. Different colored bars represent different phyla (indicated by the key), and, for the Order and Genus level plots, different tones represent different order and genera within the specified phylum. Only phyla with an abundance of >5% in at least one sample of the exposure are shown. Any other phyla are classified as “Other Bacteria.”
Figure 3
Figure 3
Venn diagram showing genera that are significantly different in abundance before and after metal exposure. Significance tested by the Wald test (p ≤ 0.05). See Fig. 6 and Supplementary Table S1 for taxa names.
Figure 4
Figure 4
Alpha Diversity. Top row: Number of OTUs observed in each cohort pre- (D0) and post-exposure (D5) for the indicated metal. Middle row: Faith’s Phylogenetic Diversity (PD) pre (D0) and post-exposure (D5). Bottom row: Shannon’s diversity index for each cohort pre- (D0) and post-exposure (D5) for the indicated metal. In each plot, color indicates dose level.
Figure 5
Figure 5
Principal Coordinate Analysis using the Bray-Curtis distance metric. The main figure shows first two coordinate axes from a Principal Coordinate Analysis based on the bray distance. Shape indicates day of sampling. Color indicates type of metal exposure, and shading indicates dose level. The small shapes indicate individual samples, and large shapes indicate centroids. Arrows connect the pre- and post-exposure centroids for each cohort.
Figure 6
Figure 6
Heat map showing the average log-fold change relative to sham controls. Red cells indicate increased abundance due to treatment. The phylum is indicated by bars to the left. Only taxa that were significantly changed in at least one test are shown. Only the family and genus are shown, see Supplementary Table S1 for complete taxonomy. *Indicates significant association of exposure with change in abundance (Wald test) at p ≤ 0.05.
Figure 7
Figure 7
Relative abundance (+/− SEM) of KEGG orthologs belonging to the iron complex transport system, as estimated by PICRUSt.

References

    1. Clemente JC, Ursell LK, Parfrey LW, Knight R. The impact of the gut microbiota on human health: an integrative view. Cell. 2012;148:1258–1270. doi: 10.1016/j.cell.2012.01.035. - DOI - PMC - PubMed
    1. Cox LM, et al. Altering the intestinal microbiota during a critical developmental window has lasting metabolic consequences. Cell. 2014;158:705–721. doi: 10.1016/j.cell.2014.05.052. - DOI - PMC - PubMed
    1. Hooper LV, Littman DR, Macpherson AJ. Interactions between the microbiota and the immune system. Science (New York, N.Y.) 2012;336:1268–1273. doi: 10.1126/science.1223490. - DOI - PMC - PubMed
    1. Ley RE, et al. Obesity alters gut microbial ecology. Proceedings of the National Academy of Sciences of the United States of America. 2005;102:11070–11075. doi: 10.1073/pnas.0504978102. - DOI - PMC - PubMed
    1. Hartstra AV, Bouter KE, Backhed F, Nieuwdorp M. Insights into the role of the microbiome in obesity and type 2 diabetes. Diabetes Care. 2015;38:159–165. doi: 10.2337/dc14-0769. - DOI - PubMed

Publication types