. 2018 Apr 26;50(5):727-736.
doi: 10.1038/s41588-018-0107-y.

An analytical framework for whole-genome sequence association studies and its implications for autism spectrum disorder

Affiliations

An analytical framework for whole-genome sequence association studies and its implications for autism spectrum disorder

Donna M Werling et al. Nat Genet. .

Abstract

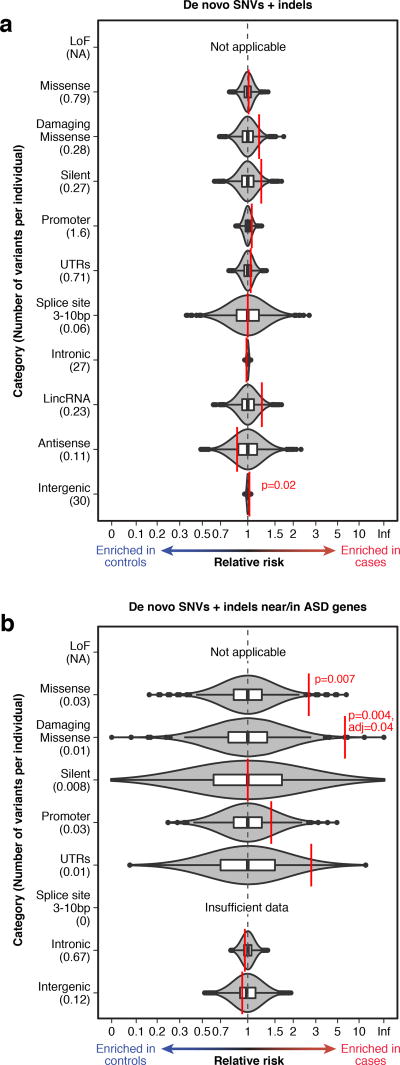
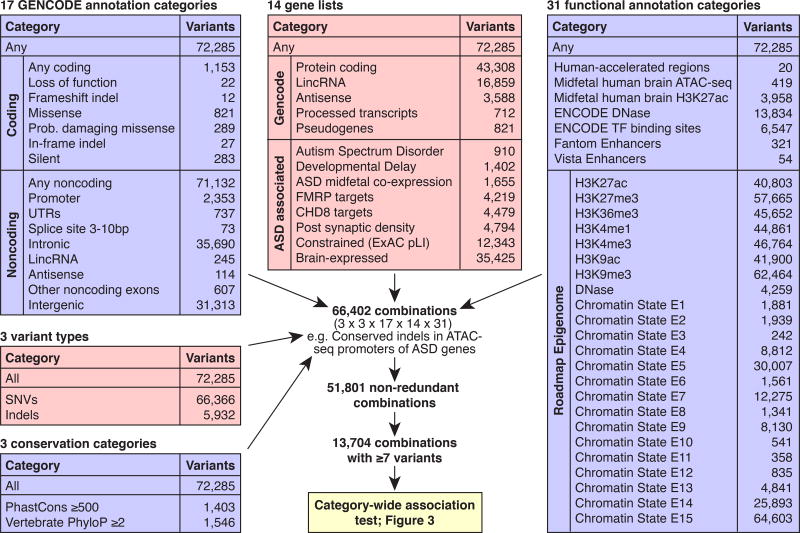
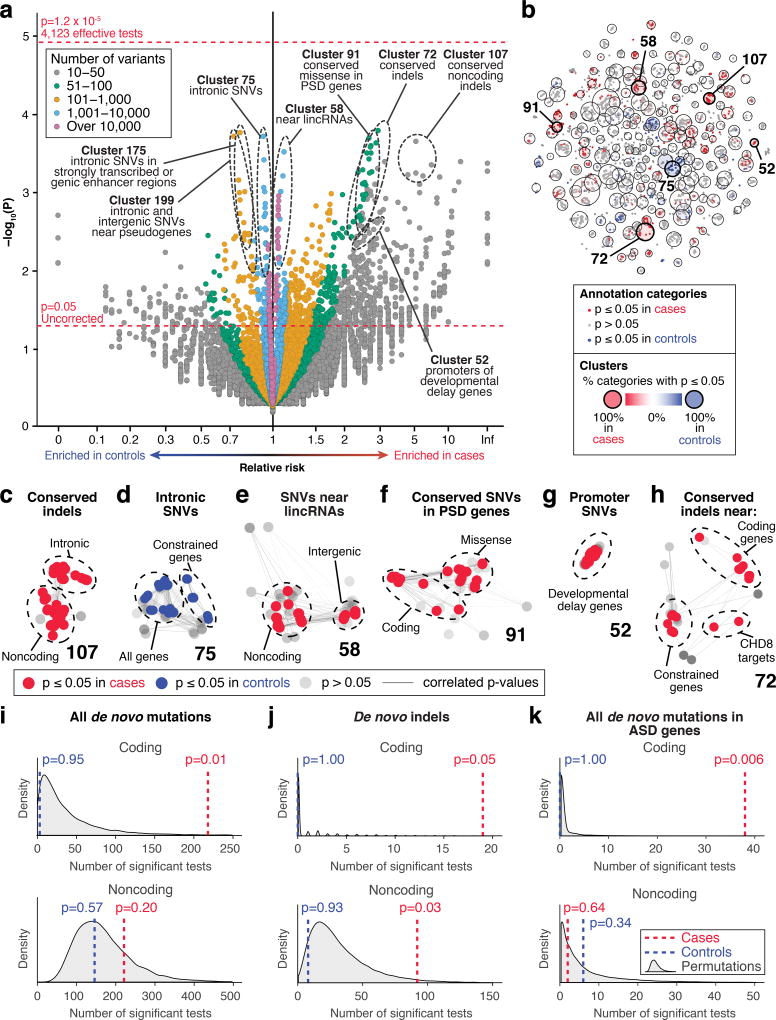
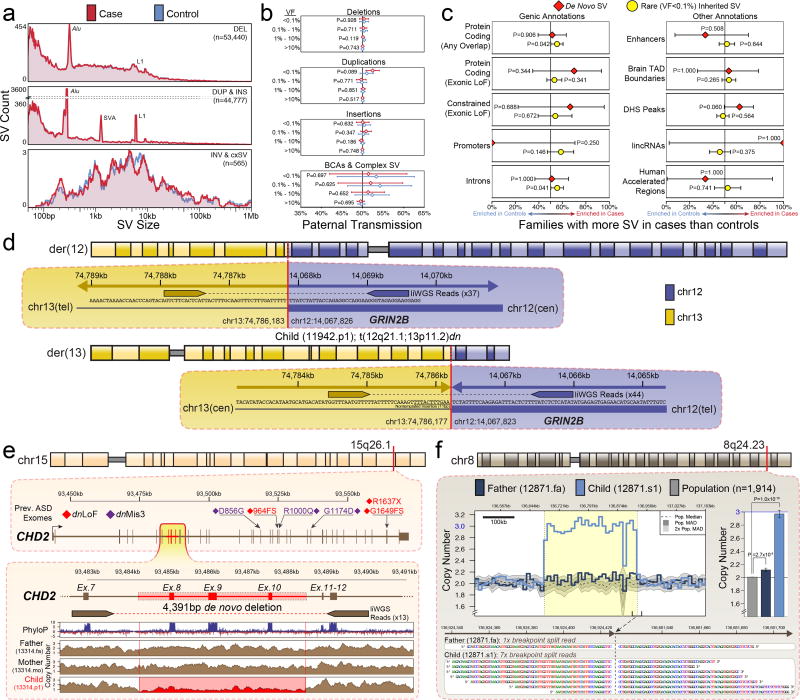
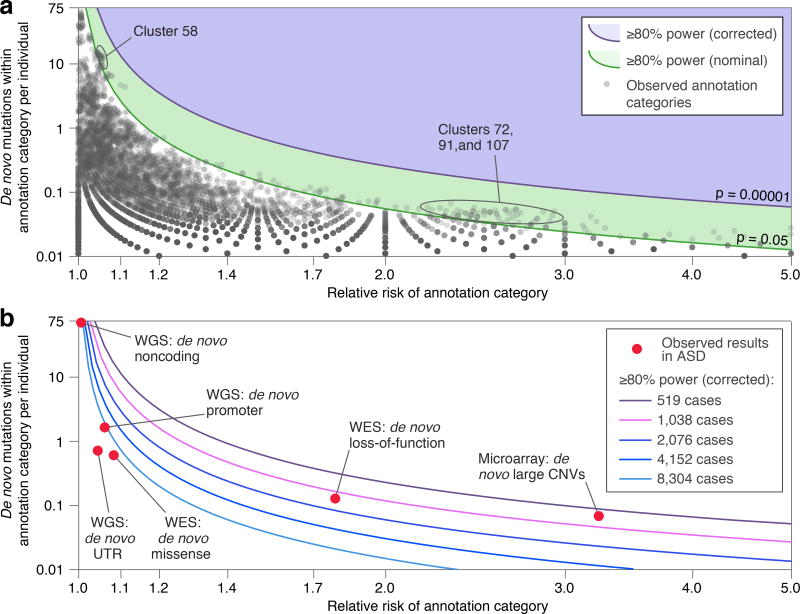
Genomic association studies of common or rare protein-coding variation have established robust statistical approaches to account for multiple testing. Here we present a comparable framework to evaluate rare and de novo noncoding single-nucleotide variants, insertion/deletions, and all classes of structural variation from whole-genome sequencing (WGS). Integrating genomic annotations at the level of nucleotides, genes, and regulatory regions, we define 51,801 annotation categories. Analyses of 519 autism spectrum disorder families did not identify association with any categories after correction for 4,123 effective tests. Without appropriate correction, biologically plausible associations are observed in both cases and controls. Despite excluding previously identified gene-disrupting mutations, coding regions still exhibited the strongest associations. Thus, in autism, the contribution of de novo noncoding variation is probably modest in comparison to that of de novo coding variants. Robust results from future WGS studies will require large cohorts and comprehensive analytical strategies that consider the substantial multiple-testing burden.


Figures

Figure 1
Figure 1. Burden analyses for gene-defined annotation categories
a) The observed relative risk of de novo mutations in cases vs. controls is shown by the red line against grey violin plots representing the kernel density estimation of relative risk from 10,000 label-swapping permutations of case-control status for 11 gene-defined annotation categories. Box plots further illustrate the relative risk from permutations, including the median (center line), first and third quartiles (box), 1.5x interquartile range or the most extreme value (whiskers), and permuted relative risk observations beyond 1.5x interquartile range (outlier points). P-values from a case-control label-swapping permutation analysis and Bonferroni-corrected p-values (10 tests) ≤0.05 are shown. Loss-of-function variants were not analyzed as cases with such mutations were excluded from the cohort. b) The analysis in ‘a’ is repeated considering only de novo mutations in or near 179 ASD genes. Permutation p-values are Bonferroni-corrected for 7 tests. Considering SNVs and indels separately does not alter these findings (Supplementary Fig. 5).
Figure 2
Figure 2. Defining annotation categories
Five groups of annotations were defined: 1) Conservation across species; 2) Variant type; 3) GENCODE gene definitions; 4) Gene lists; and 5) Functional annotations. Picking one annotation from each group resulted in 66,402 possible combinations of which 51,801 were non-redundant (Supplementary Table 7). The 13,704 annotations categories that included at least seven observed mutations were considered in the category-wide association test.
Figure 3
Figure 3. Category-wide association study
a) The burden of de novo SNVs and indels in n=519 cases vs. n=519 controls for 13,704 annotation categories with ≥7 observed variants are shown as points in the volcano plot (Supplementary Table 7). Permutation p-values were calculated by 10,000 label-swapping permutations of case-control status in each annotation category. No test survives Bonferroni correction for 4,123 effective tests (top horizontal red line). b) Correlations of p-values between annotation categories (small dots) in simulated data are shown by proximity in the first two t-SNE dimensions. The large circles show 200 independent clusters of annotation categories defined by k-means clustering. The circle size represents the degrees of freedom accounted for by the cluster using Eigenvalue decomposition. In total, 4,123 effective tests explain 99% of the variability in p-values (Supplementary Fig. 6). c–h) Six clusters from (b) are shown in greater detail, with cluster number in bold. The edges represent p-value correlation ≥0.4. i–k) The number of nominally significant annotation categories (p≤0.05 from two-sided binomial test) was calculated for cases, controls, and 10,000 permutations to assess whether more annotation categories are enriched for de novo variants in cases than expected in (a). Cases have a greater than expected number of nominally significant categories relating to coding mutations and noncoding indels, but not for all noncoding mutations, nor for noncoding mutations nearest to ASD genes. P-values were calculated as the proportion of permutations in which the same or a greater number of categories had a two-sided binomial test p-value ≤0.05 as in the observed data.
Figure 4
Figure 4. Structural variation in 519 ASD families
Structural variation (SV) analyses identified an average of 5,863 SVs per genome 171 de novo SVs. a) We observed no difference in distribution of SV sizes between cases (n=519) and sibling controls (n=519) for any class of SV (cxSV = complex SV) at an unadjusted nominal significance threshold (two-tailed Wilcoxon rank-sum test; alpha = 0.05). b) We observed no differences in maternal/paternal transmission rates between cases and sibling controls for any class of SV or any range of variant frequencies (VF) (two-tailed binomial test). Mean paternal transmission rate (dot) and 95% binomial confidence intervals are shown in plot (error bars). c) We observed no significant enrichments for either de novo or rare inherited SV (VF < 0.1%) in genic or noncoding annotations after correcting for multiple comparisons in a two-sided sign test between case and control counts. Error bars represent the 95% confidence intervals. d) Analysis of balanced SV discovered a de novo reciprocal translocation in a case predicted to disrupt GRIN2B (t(12q21.2;13p11.2)), a constrained gene previously implicated in ASD,. e) WGS revealed small CNVs undetected by previous analyses, including a 4,391bp de novo deletion of exons 8–10 of CHD2 (GRCh37.63:chr15:g.93484245_93488636del), a gene previously implicated in ASD from de novo coding mutations. f) Analysis of breakpoint sequences also classified 23 de novo SVs that were predicted to be germline mosaic in the parents, including this 242.8kb paternally transmitted mosaic duplication at 8q24.23 that was previously characterized as de novo in the child (GRCh37.63:chr8:g.136681615_136924426dup). Bar plots represent the means and 95% confidence intervals of estimated copy number in the duplicated locus. All p-values were calculated with a two-tailed t-test of estimated copy numbers in sequential 36.4kb bins.
Figure 5
Figure 5. Effective number of tests in CWAS and power calculation
a) The green line shows the threshold to achieve 80% power at nominal significance across the range of relative risks of a category (log10 scaled x-axis) and number of de novo mutations per individual within the category (log10 scaled y-axis). The purple line shows the 80% power corrected for 4,123 effective tests. The grey dots represent the observed results for de novo mutation burden in 519 families for the 13,704 annotation categories with ≥7 mutations. b) The lines show the threshold of 80% power across the range of relative risks and category sizes as sample size increases (correcting for correspondingly more effective tests, see Supplementary Information). For reference, the relative location for six classes of variation are shown.

Comment in

References

    1. Schizophrenia Working Group of the Psychiatric Genomics, C. Biological insights from 108 schizophrenia-associated genetic loci. Nature. 2014;511:421–7. - PMC - PubMed
    1. Astle WJ, et al. The Allelic Landscape of Human Blood Cell Trait Variation and Links to Common Complex Disease. Cell. 2016;167:1415–1429. e19. - PMC - PubMed
    1. de Lange KM, et al. Genome-wide association study implicates immune activation of multiple integrin genes in inflammatory bowel disease. Nat Genet. 2017;49:256–261. - PMC - PubMed
    1. Sanders SJ, et al. Insights into Autism Spectrum Disorder Genomic Architecture and Biology from 71 Risk Loci. Neuron. 2015;87:1215–33. - PMC - PubMed
    1. Deciphering Developmental Disorders, S. Prevalence and architecture of de novo mutations in developmental disorders. Nature. 2017;542:433–438. - PMC - PubMed

Publication types

Substances