. 2018 May;50(5):737-745.
doi: 10.1038/s41588-018-0108-x. Epub 2018 Apr 26.

Comparison of methods that use whole genome data to estimate the heritability and genetic architecture of complex traits

Affiliations

Comparison of methods that use whole genome data to estimate the heritability and genetic architecture of complex traits

Luke M Evans et al. Nat Genet. 2018 May.

Abstract

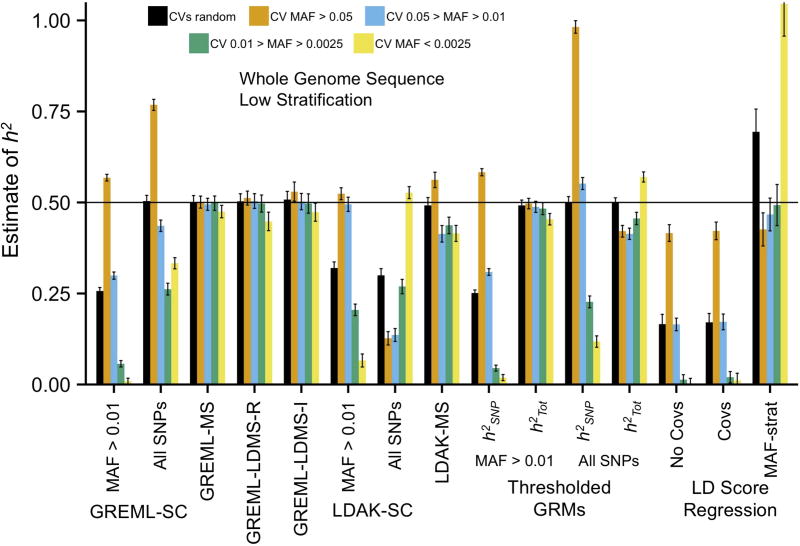
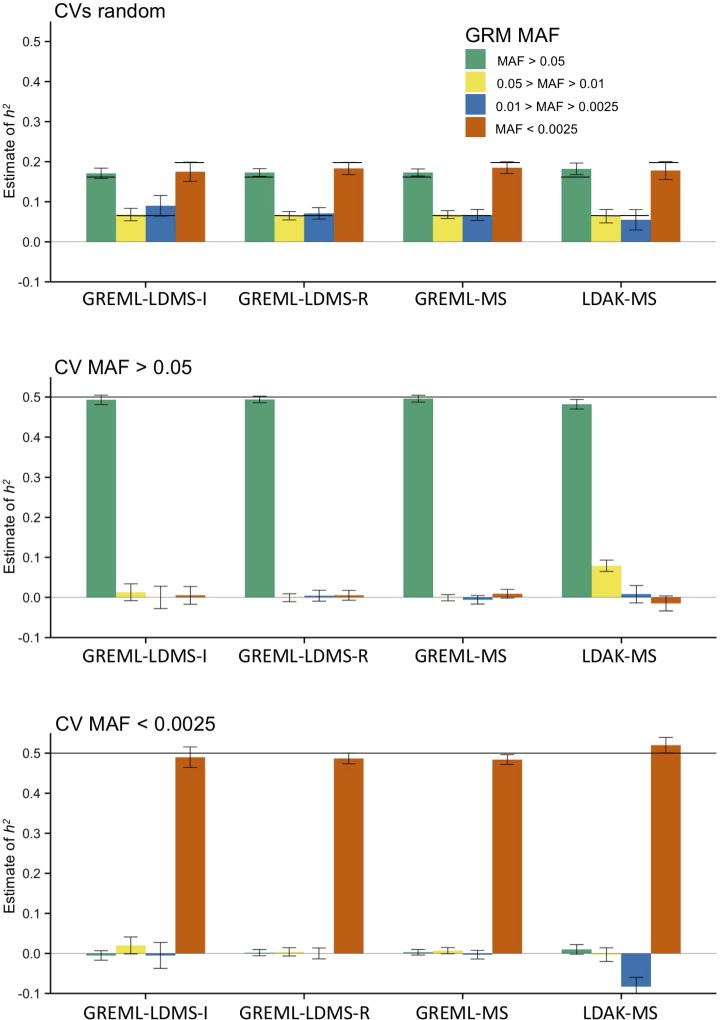
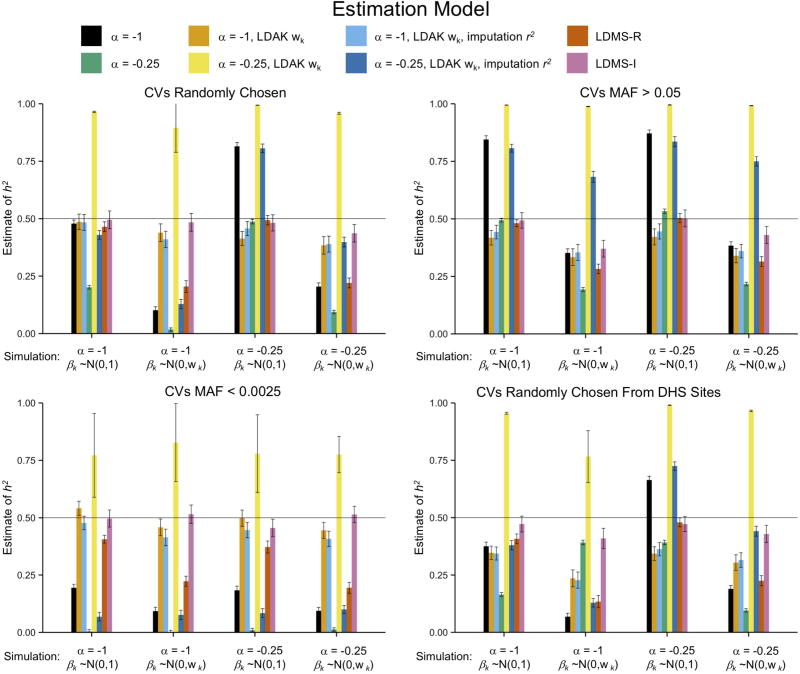
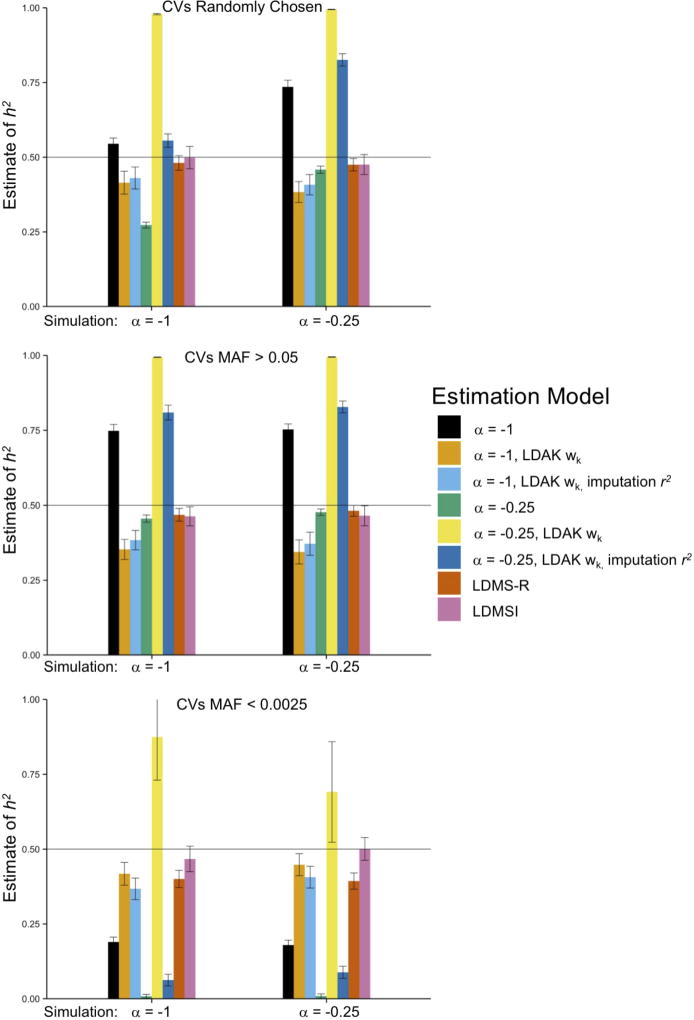
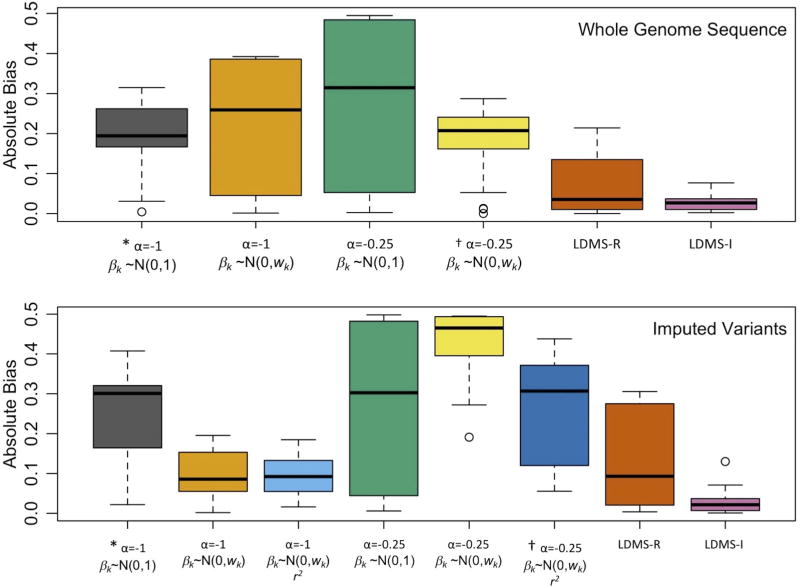
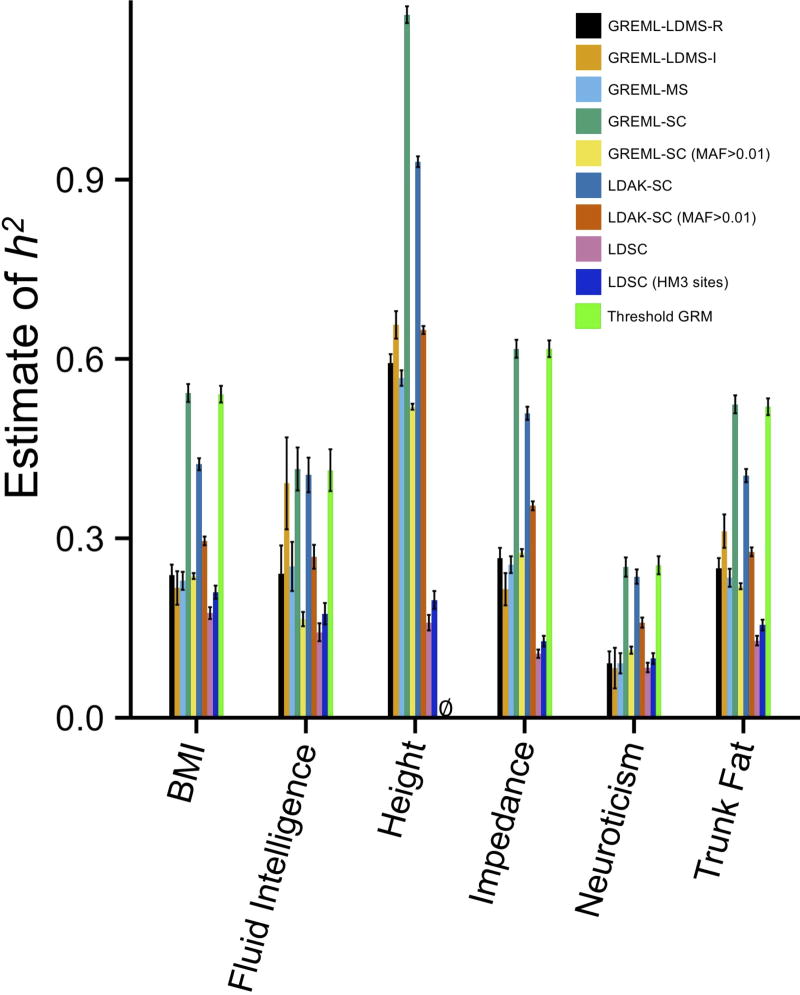
Multiple methods have been developed to estimate narrow-sense heritability, h2, using single nucleotide polymorphisms (SNPs) in unrelated individuals. However, a comprehensive evaluation of these methods has not yet been performed, leading to confusion and discrepancy in the literature. We present the most thorough and realistic comparison of these methods to date. We used thousands of real whole-genome sequences to simulate phenotypes under varying genetic architectures and confounding variables, and we used array, imputed, or whole genome sequence SNPs to obtain 'SNP-heritability' estimates. We show that SNP-heritability can be highly sensitive to assumptions about the frequencies, effect sizes, and levels of linkage disequilibrium of underlying causal variants, but that methods that bin SNPs according to minor allele frequency and linkage disequilibrium are less sensitive to these assumptions across a wide range of genetic architectures and possible confounding factors. These findings provide guidance for best practices and proper interpretation of published estimates.


Conflict of interest statement

COMPETING FINANCIAL INTERESTS

The authors declare no competing financial interests.

Figures

Figure 1
Figure 1
Mean h^SNP2 across 100 replicates from GRMs built from WGS SNPs in the least structured subsamples. Methods on the x-axis as follows: Single-component GREML (GREML-SC) with all SNPs or only MAF > 0.01; MAF-stratified GREML (GREML-MS); LD and MAF-stratified GREML (GREML-LDMS-R [regional LD] & -I [individual SNP LD]); Single-component Linkage Disequilibrium-Adjusted Kinships (LDAK-SC) with all SNPs or only MAF > 0.01; MAF-stratified LDAK (LDAK-MS); Extended Genealogy with Thresholded GRMs with all SNPs or only common (MAF > 0.01), presenting both h2SNP and h2Tot (=h2SNP + h2ibs>t); LD score regression (LDSC) using no PCs as covariates in GWAS, using PCs as covariates, or partitioned using PCs with MAF-stratification. Estimates are from samples of unrelated individuals (relatedness <0.05) except for those from the Threshold GRM method, which included all individuals. Simulated (true) h2 = 0.5. Colors represent the MAF range of the 1,000 randomly drawn CVs. See Online Methods for descriptions of each method and Supplementary Figures for additional estimates and Supplementary Table 2 for numerical results. Error bars represent 95% confidence intervals.
Figure 2
Figure 2
Mean h^SNP2 for four MAF bins across 100 replicates from multi-component approaches in unrelated individuals using WGS SNPs in the least structured subsample. See Fig. 1 for specific methods. Black lines are the true (simulated) h2 values; note that in the top panel, the true h2 values differ across MAF. See Online Methods for descriptions of each method and Supplementary Figures for additional estimates and Supplementary Table 4 for numerical results. Error bars represent 95% confidence intervals.
Figure 3
Figure 3
Mean h^SNP2 across 100 replicates from GRMs built from imputed SNPs in the least structured subsamples across different model assumptions (bars) and different ways of simulating CVs (x-axes). The x-axes of each panel show the simulated CV MAF-scaling parameter, α, and the CV effect size distribution, βk. The four panels show different MAF ranges of the 1,000 randomly-drawn CVs. DHS sites were randomly sampled without respect to MAF. Bar colors indicate the fitted model, with a single GRM used except for the “LDMS” models, which used 16 GRMs (α=−1) stratified by MAF and either regional (-R) or individual SNP (-I) LD score. See Online Methods for descriptions of each method and Supplementary Figures for additional estimates and Supplementary Table 6 for numerical results. Error bars represent 95% confidence intervals.
Figure 4
Figure 4
Mean h^SNP2 across 100 replicates from GRMs built from imputed SNPs in the least structured subsamples across different model assumptions (bars) and different ways of simulating CVs (x-axes). CV effect sizes were simulated from ~N(0,τk). The x-axes of each panel show the simulated CV MAF-scaling parameter, α. The three panels show different MAF ranges of the 1,000 randomly-drawn CVs. Bar colors indicate the fitted model. See Online Methods for descriptions of each method and Supplementary Figures for additional estimates and Supplementary Table 6 for numerical results. Error bars represent 95% confidence intervals.
Figure 5
Figure 5
Boxplots of the absolute bias of heritability estimates (|E(h^SNP2)h2|) across all simulated phenotypes from Supplementary Figures 24 & 26 using WGS data to estimate GRMs (top), and from Figures 3–4 using imputed variants to estimate the GRMs (bottom). X axis indicates the parameters for the estimation model, including the MAF scaling factor, α, and the assumed effect size distribution, βk, specified in the GRM and whether imputation scores (r2) were used in the GRM estimation. All used a single GRM except for LD- & MAF-stratified GREML (LDMS), which used 16 GRMs (α=−1) stratified by MAF and either regional (-R) or individual SNP (-I) LD score. * Typical GREML-SC parameters. † Typical LDAK-SC parameters. Boxplots show the median and interquartile, with whiskers extending 1.5 times the quartiles and more extreme points shown for N=22 (WGS) and 26 (imputed) mean estimates of heritability.
Figure 6
Figure 6
Estimated h^SNP2 using multiple methods with imputed variants for six complex traits in the UK Biobank. MAF>0.01 indicates common SNPs were used to create the GRMs. ∅ = information matrix was not invertible. HM3 indicates that only imputed HapMap3 sites were used in the LDSC analysis. Sample sizes as follows: height N=94,769; BMI N=94,595; impedance N=93,451; trunk fat N=93,414; fluid intelligence N=31,724; neuroticism N=78,565. See Supplementary Table 8 for numerical results. Error bars are 1 S.E.M.

References

    1. Tenesa A, Haley CS. The heritability of human disease: estimation, uses and abuses. Nat. Rev. Genet. 2013;14:139–149. - PubMed
    1. Visscher PM, Hill WG, Wray NR. Heritability in the genomics era--concepts and misconceptions. Nat. Rev. Genet. 2008;9:255–66. - PubMed
    1. Keller MC, Coventry WL. Quantifying and addressing parameter indeterminacy in the classical twin design. Twin Res. Hum. Genet. 2005;8:201–213. - PubMed
    1. Eaves LJ, Last KA, Young PA, Martin NG. Model-fitting approaches to the analysis of human behaviour. Heredity (Edinb) 1978;41:249–320. - PubMed
    1. Yang J, et al. Common SNPs explain a large proportion of the heritability for human height. Nat. Genet. 2010;42:565–569. - PMC - PubMed

Publication types

LinkOut - more resources