

Using data from multiple studies to develop a child growth correlation matrix
- PMID: 29700850
- PMCID: PMC6767589
- DOI: 10.1002/sim.7696
Using data from multiple studies to develop a child growth correlation matrix
Abstract
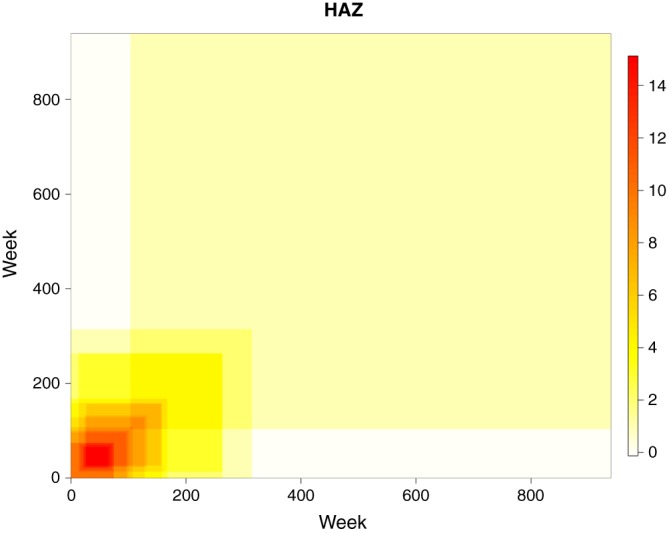
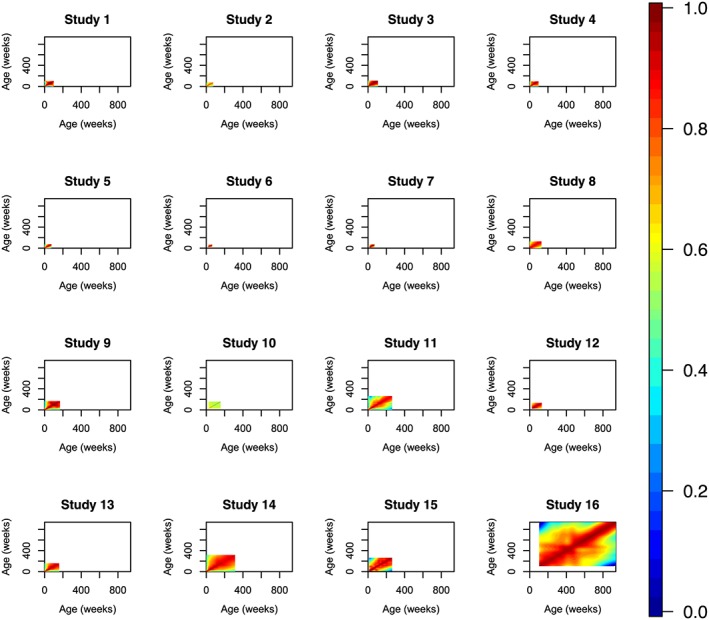
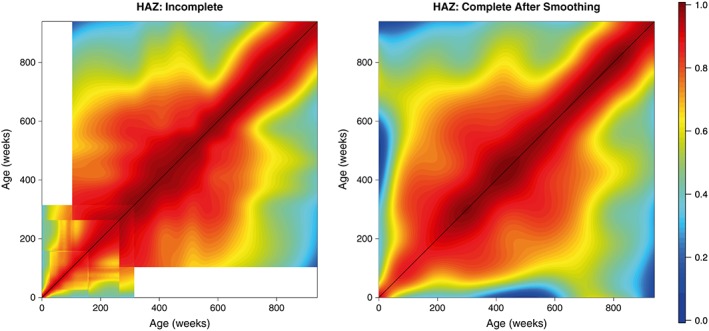
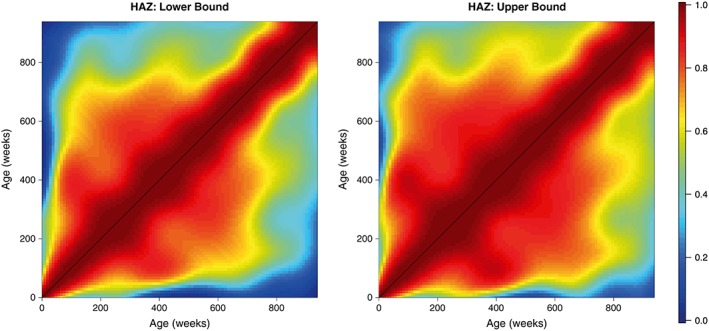
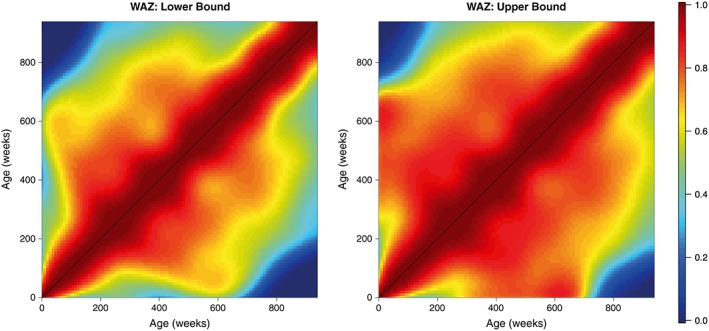
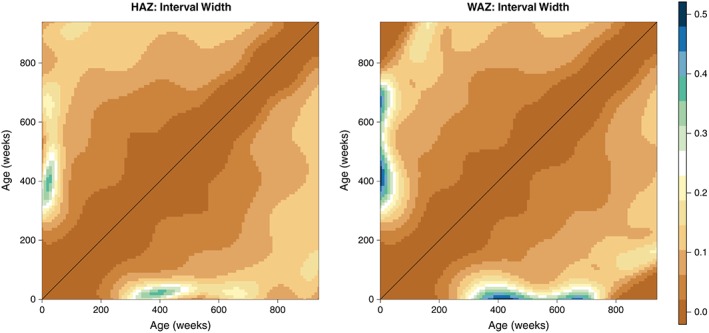
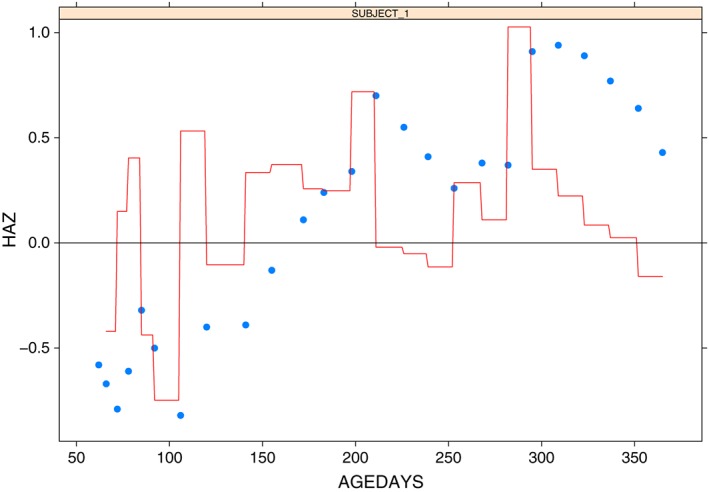
In many countries, the monitoring of child growth does not occur in a regular manner, and instead, we may have to rely on sporadic observations that are subject to substantial measurement error. In these countries, it can be difficult to identify patterns of poor growth, and faltering children may miss out on essential health interventions. The contribution of this paper is to provide a framework for pooling together multiple datasets, thus allowing us to overcome the issue of sparse data and provide improved estimates of growth. We use data from multiple longitudinal growth studies to construct a common correlation matrix that can be used in estimation and prediction of child growth. We propose a novel 2-stage approach: In stage 1, we construct a raw matrix via a set of univariate meta-analyses, and in stage 2, we smooth this raw matrix to obtain a more realistic correlation matrix. The methodology is illustrated using data from 16 child growth studies from the Bill and Melinda Gates Foundation's Healthy Birth Growth and Development knowledge integration project and identifies strong correlation for both height and weight between the ages of 4 and 12 years. We use a case study to provide an example of how this matrix can be used to help compute growth measures.
Keywords: SDS; child health; correlation; growth.
© 2018 The Authors. Statistics in Medicine Published by John Wiley & Sons Ltd.
Figures


Comment in
-
Commentary: Methods for calculating growth trajectories and constructing growth centiles.Stat Med. 2019 Aug 30;38(19):3571-3579. doi: 10.1002/sim.8129. Stat Med. 2019. PMID: 31298428 Free PMC article.
-
Response to Professor Tim Cole's commentary: Methods for calculating growth trajectories and constructing growth centiles.Stat Med. 2019 Aug 30;38(19):3584-3585. doi: 10.1002/sim.8127. Stat Med. 2019. PMID: 31298430 No abstract available.
References
-
- Tanner JM. Fetus Into Growth: Physical Growth from Conception to Maturity. Cambridge, Mass.: Harvard University Press; 1979.
-
- Tanner JM. A History of the Study of Human Growth. Cambridge: Cambridge University Press; 1981.
-
- Allen LH. Nutritional influences on linear growth: a general review. Eur J Clin Nutr. 1994;48:S75‐89. - PubMed
-
- Victora CG, de Onis M, Hallal PC, Blössner M, Shrimpton R. Worldwide timing of growth faltering: Revisiting implications for interventions. Pediatrics. 2010;125(3):e473‐80. - PubMed
-
- Prentice AM, Moore SE, Fulford AJ. Growth faltering in low‐income countries. Nutrition and Growth. 2013;106:90‐9. - PubMed
Publication types
MeSH terms
LinkOut - more resources
Full Text Sources
Other Literature Sources
Medical