. 2018 Jul:67:94-101.
doi: 10.1016/j.neuro.2018.04.015. Epub 2018 Apr 24.

Quinolinic acid and glutamatergic neurodegeneration in Caenorhabditis elegans

Affiliations

Quinolinic acid and glutamatergic neurodegeneration in Caenorhabditis elegans

Tássia Limana da Silveira et al. Neurotoxicology. 2018 Jul.

Abstract

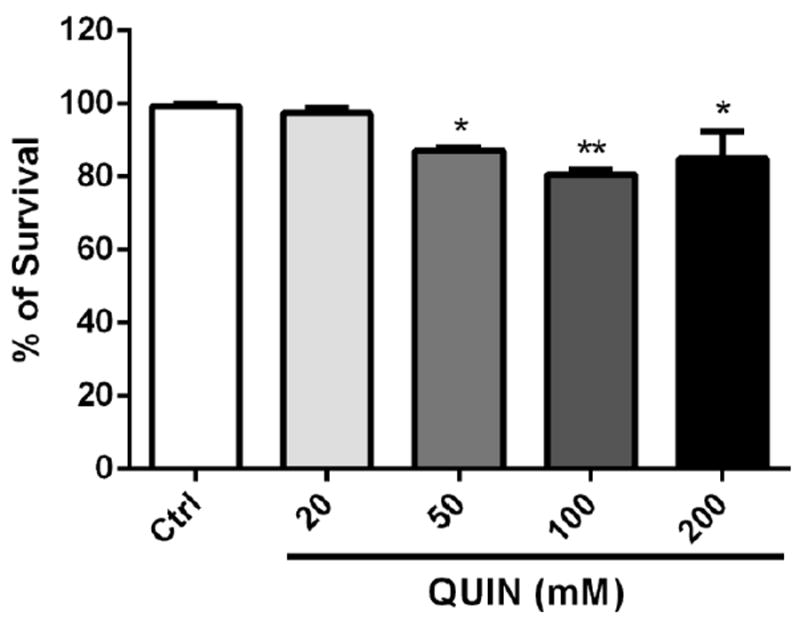
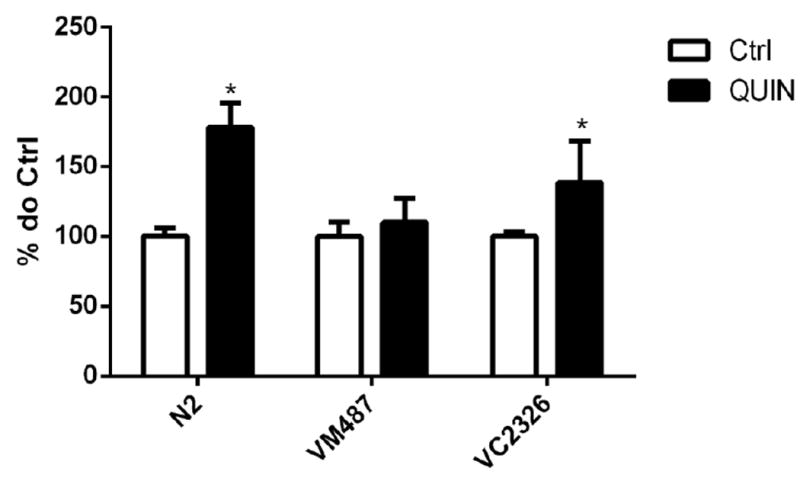
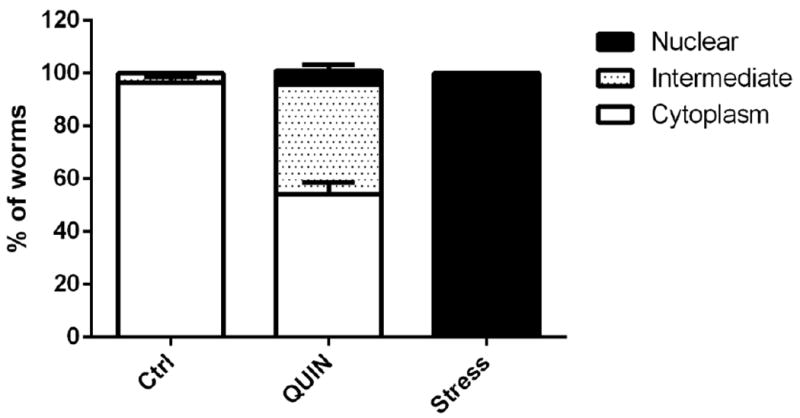
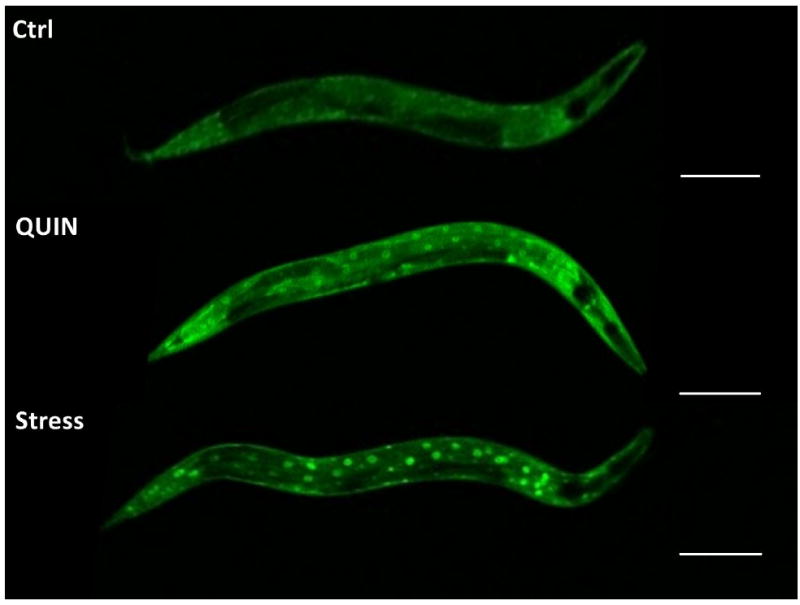
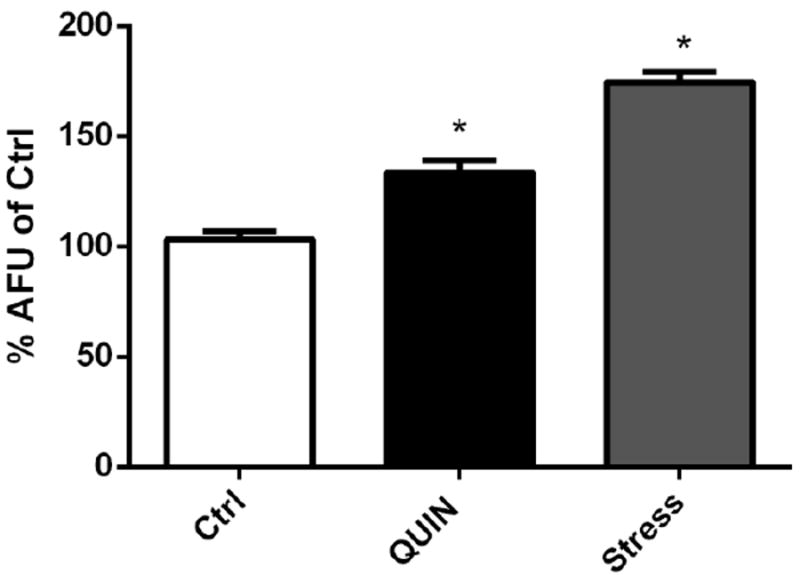
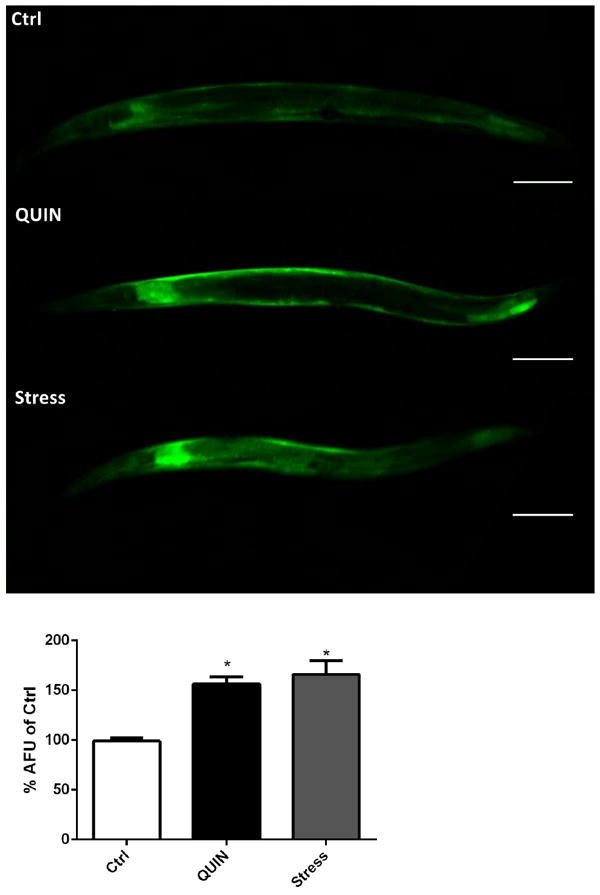
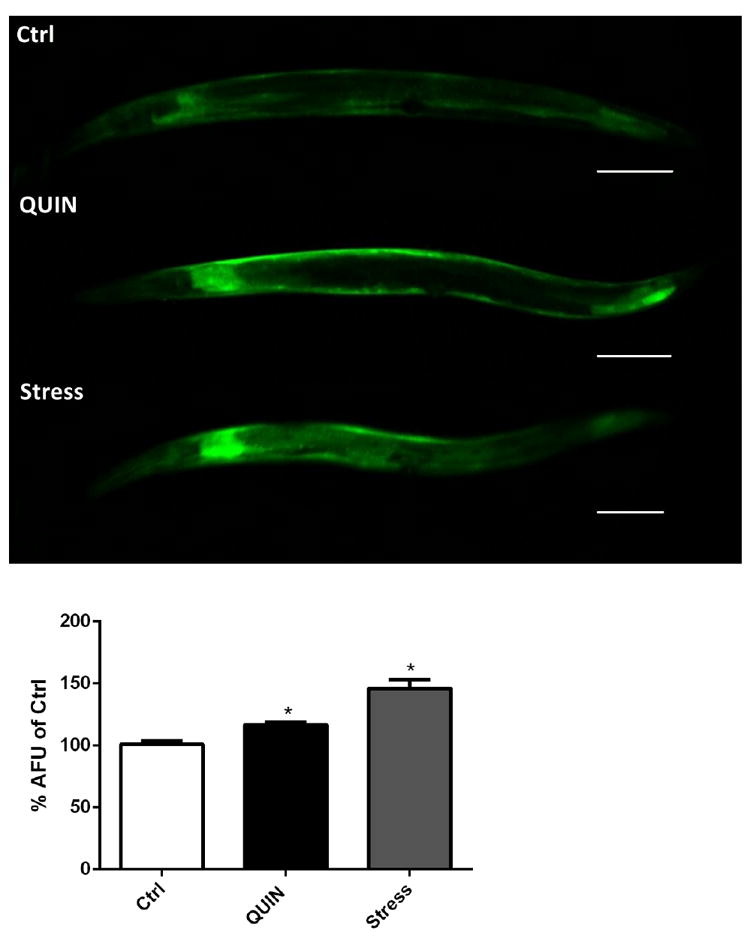
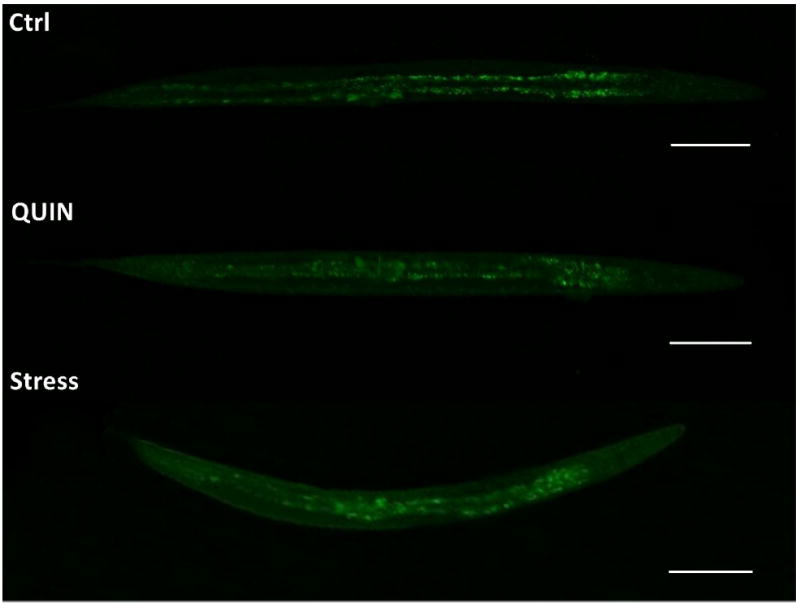
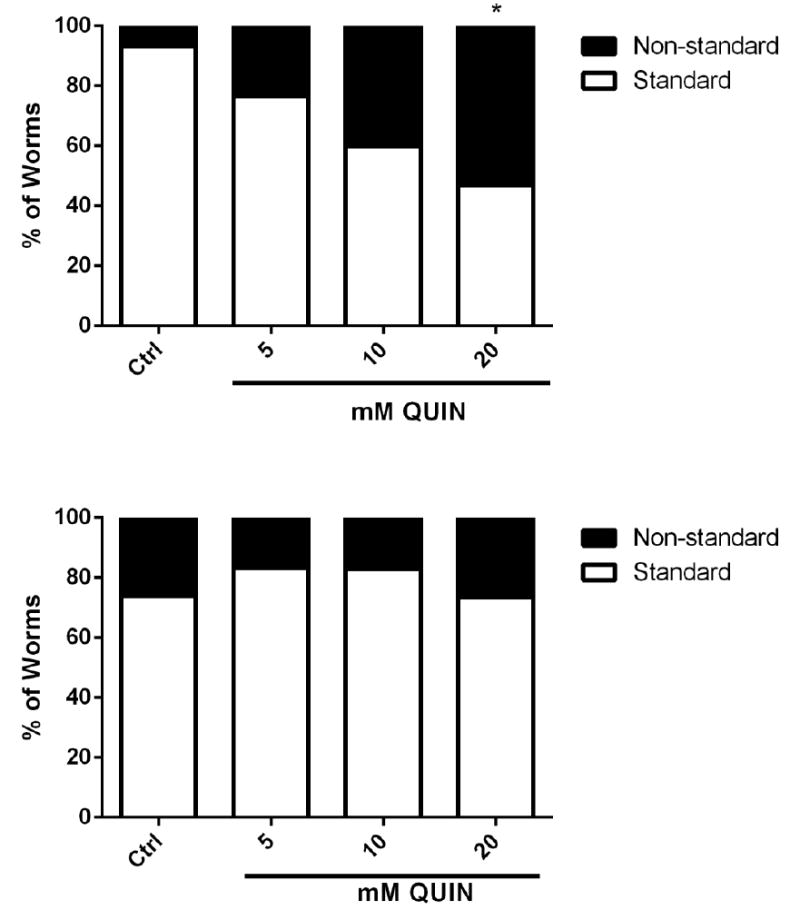
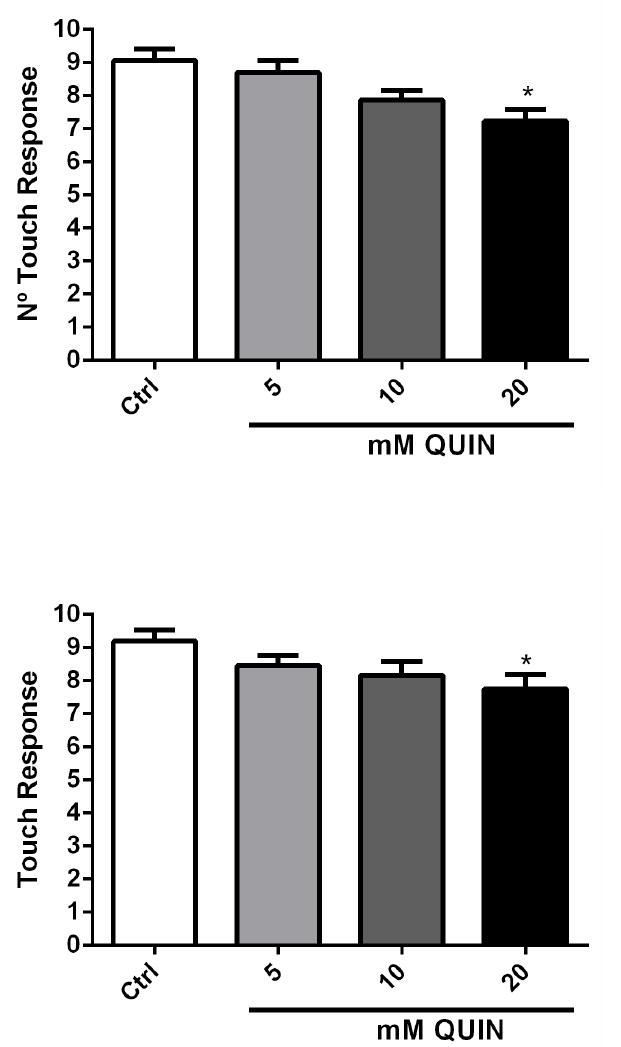
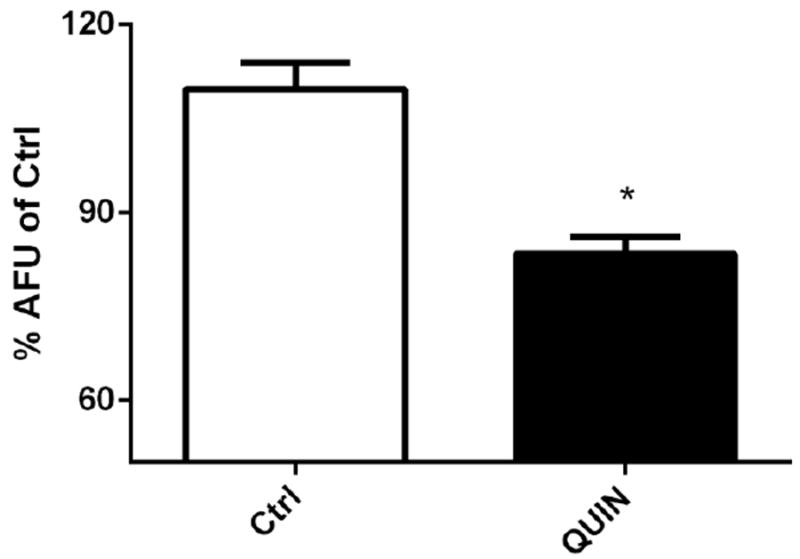
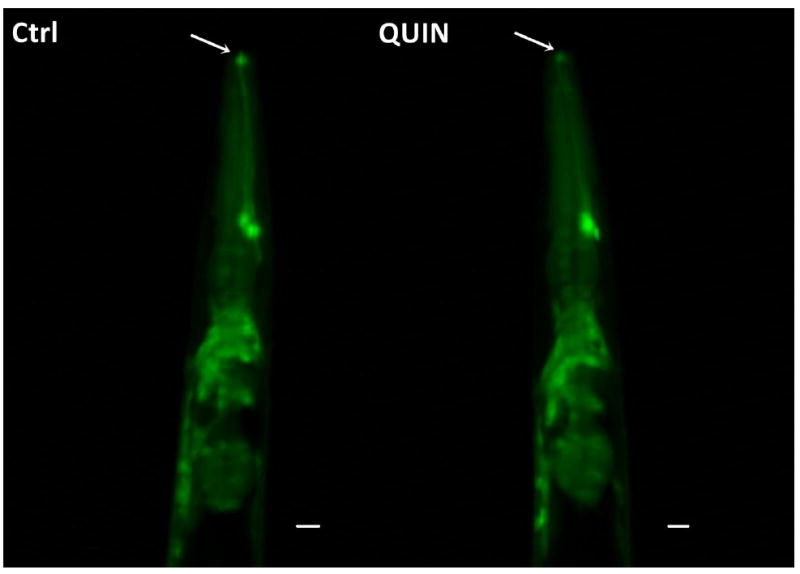
Quinolinic acid (QUIN) is an endogenous neurotoxin that acts as an N-methyl-D-aspartate receptor (NMDAR) agonist generating a toxic cascade, which can lead to neurodegeneration. The action of QUIN in Caenorhabditis elegans and the neurotoxins that allow the study of glutamatergic system disorders have not been carefully addressed. The effects of QUIN on toxicological and behavioral parameters in VM487 and VC2623 transgenic, as well as wild-type (WT) animals were performed to evaluate whether QUIN could be used as a neurotoxin in C. elegans. QUIN reduced survival of WT worms in a dose-dependent manner. A sublethal dose of QUIN (20 mM) increased reactive oxygen species (ROS) levels in an nmr-1/NMDAR-dependent manner, activated the DAF-16/FOXO transcription factor, and increased expression of the antioxidant enzymes, superoxide dismutase-3, glutathione S-transferase-4, and heat shock protein-16.2. QUIN did not change motor behavioral parameters, but altered the sensory behavior in N2 and VM487 worms. Notably, the effect of QUIN on the sensory behavioral parameters might occur, at least in part, secondary to increased ROS. However, the touch response behavior indicates a mechanism of action that is independent of ROS generation. In addition, non-lethal doses of QUIN triggered neurodegeneration in glutamatergic neurons. Our findings indicate that C. elegans might be useful as a model for studies of QUIN as a glutamatergic neurotoxin in rodent models.

Keywords: C. elegans; Glutamatergic system; NMDA; Neurodegeneration; Quinolinic acid.


Conflict of interest statement

Conflict of Interest

The authors declare that they have no conflict of interest.

Figures

Figure 1
Figure 1
Effects of QUIN on survival assay of wild-type (N2) worms. Data are expressed as percentage of living worms derived from four independent assays of 100 worms per group in each experiment (n=4 experiments per group). Error bars represent as means ± S.E.M. *p<0.01 and **p<0.001 compared to Ctrl (One-Way ANOVA followed by post-hoc Bonferroni).
Figure 2
Figure 2
Effect of QUIN on reactive oxygen species (ROS) production. Data are expressed as percentage of the arbitrary fluorescence units (AFU) of Ctrl of each strain derived from 5 independent assays (n=5). Levels of basal ROS production in wild-type (N2), VM487 (nmr-1) and VC2623 (nmr-2) mutants treated or not with the QUIN 20 mM. Error bars represent as means ± S.E.M. *p<0.05 compared to untreated group (Test-t).
Figure 3
Figure 3
Effect of QUIN in migration of daf-16 protein. A) Effect of QUIN (20 mM) and thermal stress (35° C) on DAF-16 subcellular localization in in the transgenic C. elegans TJ356 (daf-16;;GFP) strain. B) Cytosolic, intermediate and nuclear localization. Data are expressed as percent of worms exhibiting cytosolic, intermediate or nuclear pattern of location, derived from five independent assays with 10 worms per group in each experiment (n=5). Error bars represent as means ± S.E.M (Two-way ANOVA followed by post-hoc Bonferroni).
Figure 3
Figure 3
Effect of QUIN in migration of daf-16 protein. A) Effect of QUIN (20 mM) and thermal stress (35° C) on DAF-16 subcellular localization in in the transgenic C. elegans TJ356 (daf-16;;GFP) strain. B) Cytosolic, intermediate and nuclear localization. Data are expressed as percent of worms exhibiting cytosolic, intermediate or nuclear pattern of location, derived from five independent assays with 10 worms per group in each experiment (n=5). Error bars represent as means ± S.E.M (Two-way ANOVA followed by post-hoc Bonferroni).
Figure 4
Figure 4
Effect of QUIN (20mM) and thermal stress (35° C) on expression of antioxidant enzymes. (A) Quantification of SOD-3 expression and (B) representative images of the transgenic strain CF1553. (C) Quantification of GST-4 expression and (D) representative images of the transgenic strain CL2166. (E) Quantification of HSP-16.2 expression and (F) representative images of the transgenic strain CL2070. Data are expressed as percentage of the arbitrary fluorescence units (AFU) of control derived from three independent assays with 5 worms per group in each experiment (n=3). Error bars represent as means ± S.E.M. *p<0.01 compared to ctrl untreated group (One-way ANOVA followed by post-hoc Bonferroni).
Figure 4
Figure 4
Effect of QUIN (20mM) and thermal stress (35° C) on expression of antioxidant enzymes. (A) Quantification of SOD-3 expression and (B) representative images of the transgenic strain CF1553. (C) Quantification of GST-4 expression and (D) representative images of the transgenic strain CL2166. (E) Quantification of HSP-16.2 expression and (F) representative images of the transgenic strain CL2070. Data are expressed as percentage of the arbitrary fluorescence units (AFU) of control derived from three independent assays with 5 worms per group in each experiment (n=3). Error bars represent as means ± S.E.M. *p<0.01 compared to ctrl untreated group (One-way ANOVA followed by post-hoc Bonferroni).
Figure 5
Figure 5
Effect QUIN on behavioral analysis in wild-type (N2) and transgenic VM487(nmr-1) strain. Data are expressed as percent of worms with standard or altered behavior in N2 (A) and VM487 (B) derived from three independent assays with 20 worms per group in each experiment (n=5). *p<0.05 compared to non-standard behavior control (One-way ANOVA, followed by post-hoc Tukey).
Figure 6
Figure 6
Effect of QUIN on touch response behavior assays in the N2 and VM487 strains. Touch response in N2 (A) and in VM487 (B) worms. Data are derived from three independent assays with 5 worms per group in each experiment (n=15). Error bars represent as means ± S.E.M. *p<0.05 compared to control for each behavior evaluated. (One-way ANOVA followed by post-hoc Bonferroni).
Figure 7
Figure 7
Effect QUIN on neurodegeneration in the OH438 (pan-neuronal∷GFP) strain. The OH438 strain shows all GFP-labeled neurons. A) Quantification of the neurons head fluorescence, indicated neurodegeneration by reducing fluorescence, in the dates expressed as percentage of the arbitrary fluorescence units (AFU) of Ctrl. B) Images the previous region of the worm head. The arrows indicate reduction GFP-fluorescence in neurons. C) GFP-labeled ventral nerve cord without morphological alteration in QUIN-treated worms. Data are derived from three independent assays with 10 worms per group at each experiment (n=30, *p<0.020).
Figure 7
Figure 7
Effect QUIN on neurodegeneration in the OH438 (pan-neuronal∷GFP) strain. The OH438 strain shows all GFP-labeled neurons. A) Quantification of the neurons head fluorescence, indicated neurodegeneration by reducing fluorescence, in the dates expressed as percentage of the arbitrary fluorescence units (AFU) of Ctrl. B) Images the previous region of the worm head. The arrows indicate reduction GFP-fluorescence in neurons. C) GFP-labeled ventral nerve cord without morphological alteration in QUIN-treated worms. Data are derived from three independent assays with 10 worms per group at each experiment (n=30, *p<0.020).

References

    1. Chen Y, Guillemin GJ. Kynurenine pathway metabolites in humans: disease and healthy States. Int J Tryptophan Res. 2009;2:1–19. - PMC - PubMed
    1. Schwarcz R, et al. Of mice, rats and men: Revisiting the quinolinic acid hypothesis of Huntington’s disease. Prog Neurobiol. 2010;90(2):230–45. - PMC - PubMed
    1. Chen Y, Meininger V, Guillemin GJ. Recent advances in the treatment of amyotrophic lateral sclerosis. Emphasis on kynurenine pathway inhibitors. Cent Nerv Syst Agents Med Chem. 2009;9(1):32–9. - PubMed
    1. Braidy N, et al. Mechanism for quinolinic acid cytotoxicity in human astrocytes and neurons. Neurotox Res. 2009;16(1):77–86. - PubMed
    1. Perez-De La Cruz V, Konigsberg M, Santamaria A. Kynurenine pathway and disease: an overview. CNS Neurol Disord Drug Targets. 2007;6(6):398–410. - PubMed

Publication types

MeSH terms