. 2018 Apr 27;13(4):e0196087.
doi: 10.1371/journal.pone.0196087. eCollection 2018.

Anatomy of an online misinformation network

Affiliations

Anatomy of an online misinformation network

Chengcheng Shao et al. PLoS One. .

Abstract

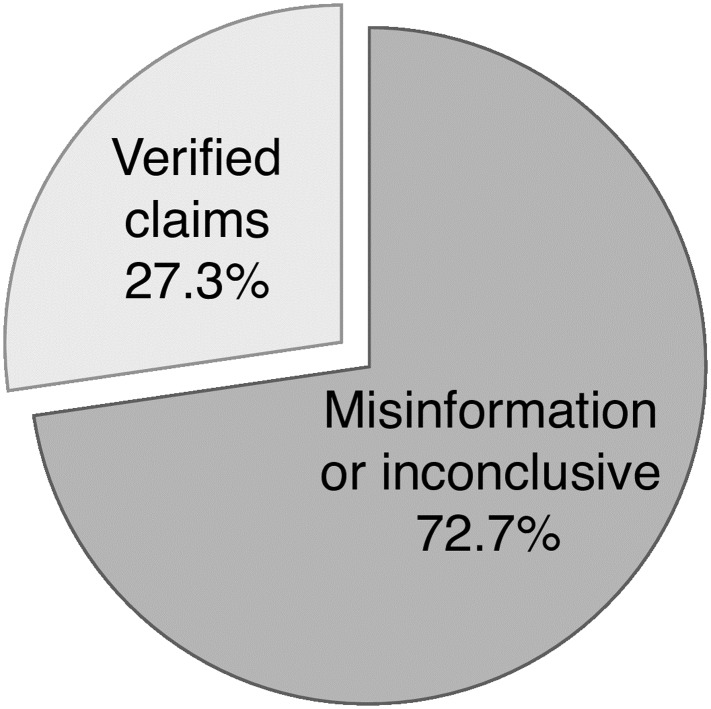
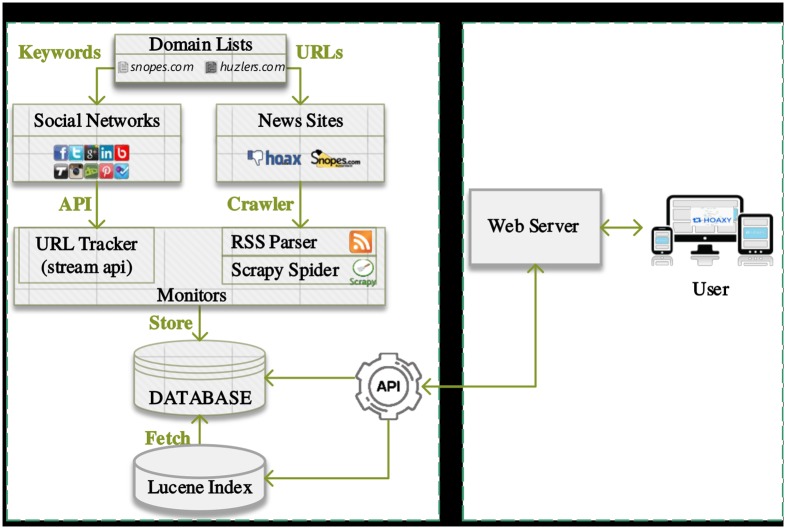
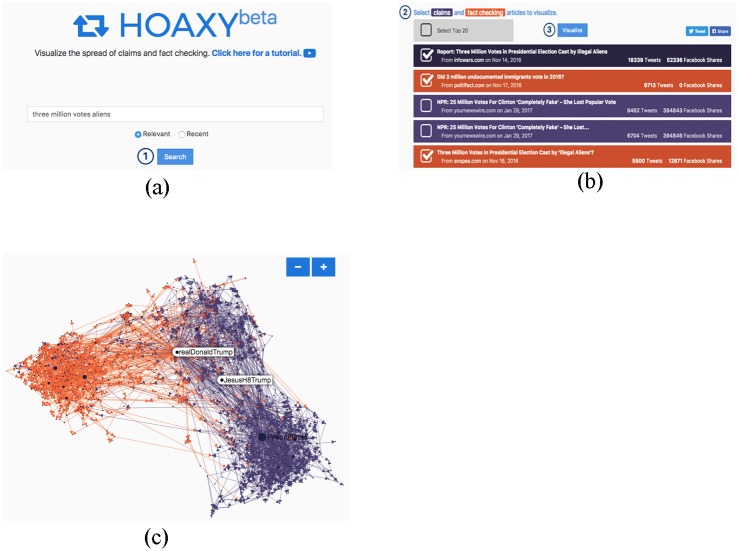
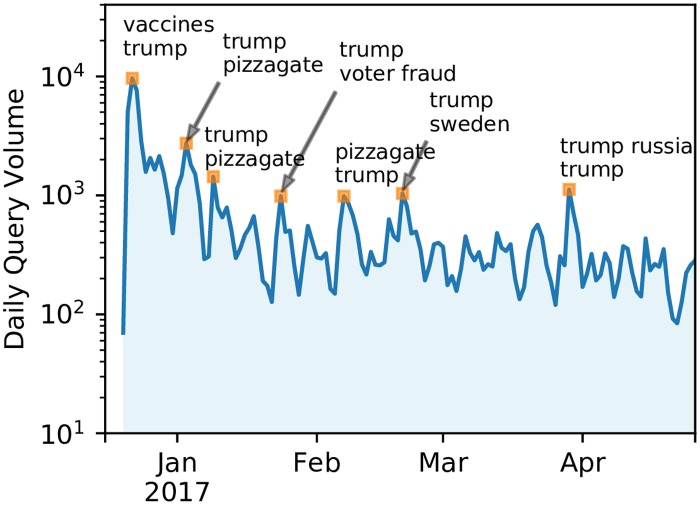
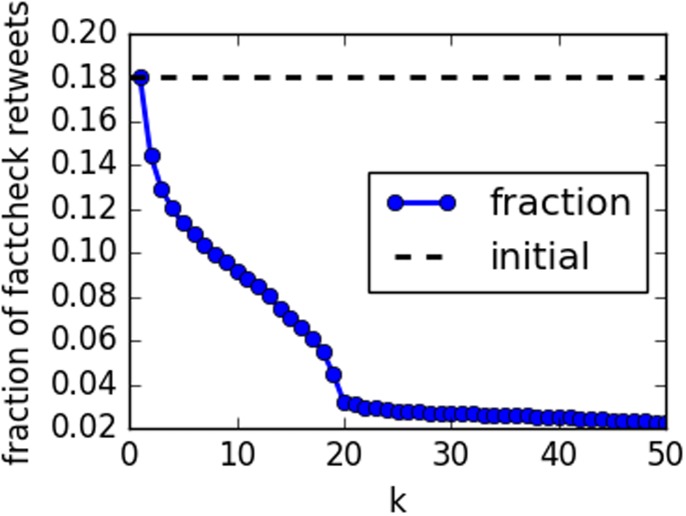
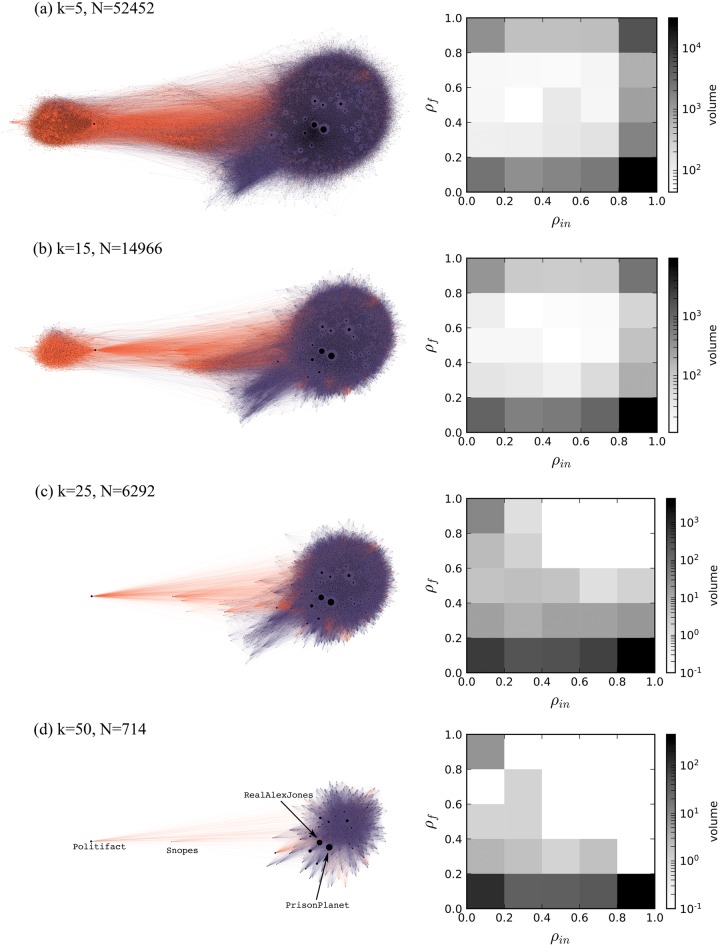
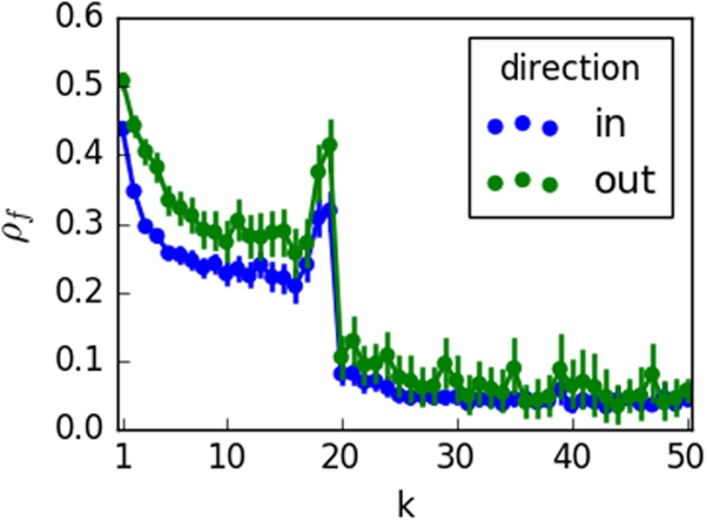
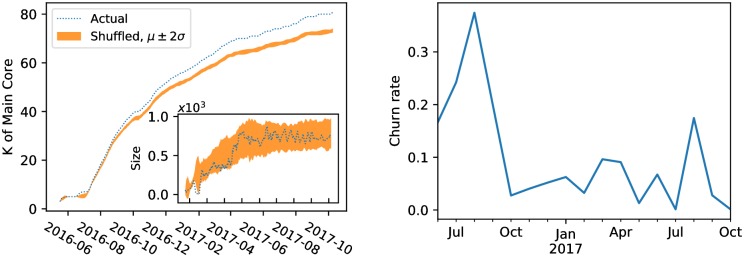
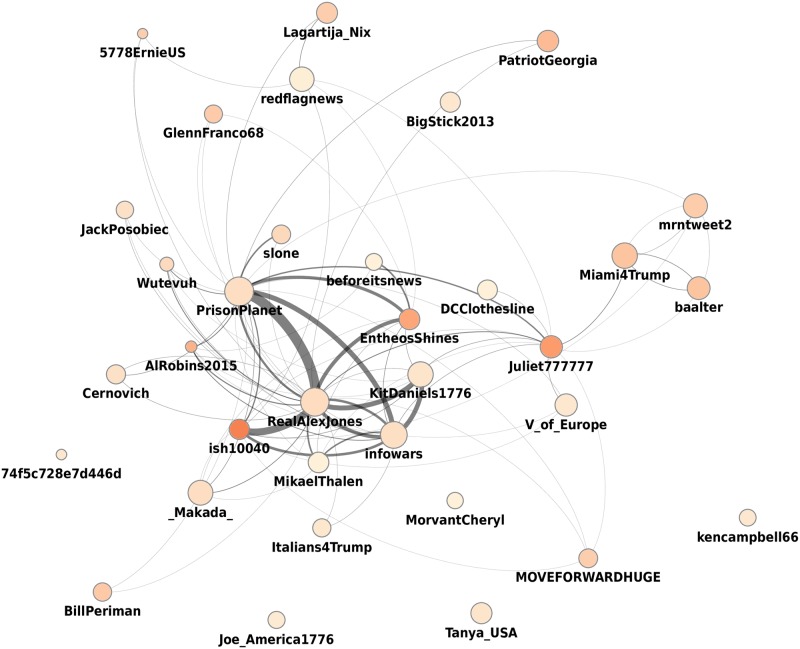
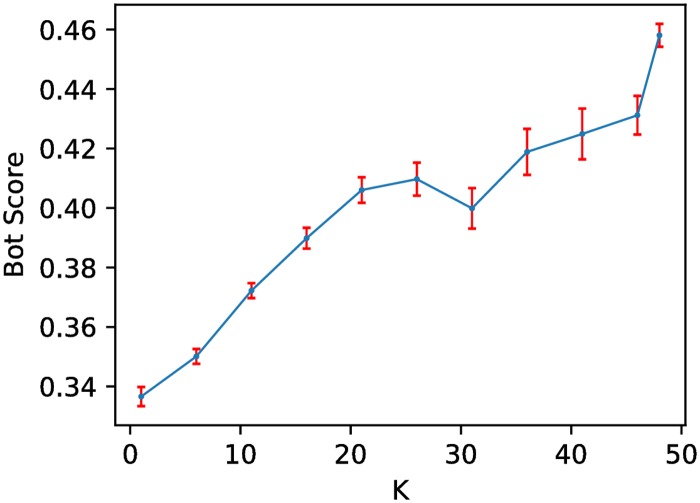
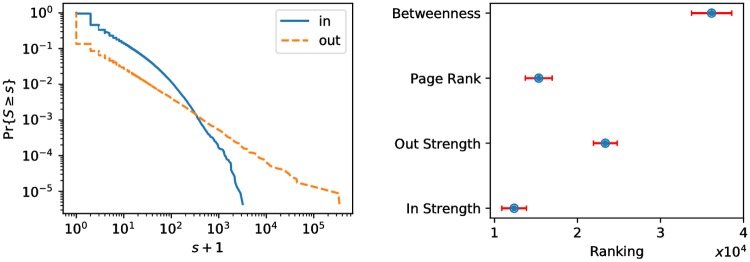
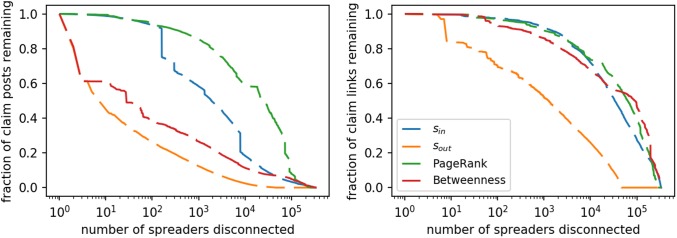
Massive amounts of fake news and conspiratorial content have spread over social media before and after the 2016 US Presidential Elections despite intense fact-checking efforts. How do the spread of misinformation and fact-checking compete? What are the structural and dynamic characteristics of the core of the misinformation diffusion network, and who are its main purveyors? How to reduce the overall amount of misinformation? To explore these questions we built Hoaxy, an open platform that enables large-scale, systematic studies of how misinformation and fact-checking spread and compete on Twitter. Hoaxy captures public tweets that include links to articles from low-credibility and fact-checking sources. We perform k-core decomposition on a diffusion network obtained from two million retweets produced by several hundred thousand accounts over the six months before the election. As we move from the periphery to the core of the network, fact-checking nearly disappears, while social bots proliferate. The number of users in the main core reaches equilibrium around the time of the election, with limited churn and increasingly dense connections. We conclude by quantifying how effectively the network can be disrupted by penalizing the most central nodes. These findings provide a first look at the anatomy of a massive online misinformation diffusion network.


Conflict of interest statement

Competing Interests: The authors have declared that no competing interests exist.

Figures

Fig 1
Fig 1. Verification based on a sample of 50 articles.
We excluded six articles with no factual claim. Articles that could not be verified are grouped with misinformation.
Fig 2
Fig 2. Hoaxy system architecture.
Fig 3
Fig 3. Screen shots from the user interface of Hoaxy: (a) the user enters a query in the search engine interface; (b) from the list of results, the user selects articles to visualize from low-credibility (purple) and/or fact-checking (orange) sources; (c) a detail from the interactive network diffusion visualization for the query “three million votes aliens”.
Edge colors represent the type of information exchanged. The network shown here displays strong polarization between articles from low-credibility and fact-checking sources, which is typical.
Fig 4
Fig 4. Usage of Hoaxy in terms of daily volume of queries since the launch of the public Web tool in December 2016.
The two most frequent search terms are shown in correspondence to some of the main peaks of user activity.
Fig 5
Fig 5. Fraction of retweets in k-core graph that link to fact-checking vs. core number k.
Fig 6
Fig 6. k-core decomposition of the pre-Election retweet network collected by Hoaxy.
Panels (a)-(d) show four different cores for values of k = 5, 15, 25, 50 respectively. Networks are visualized using a force-directed layout. Edge colors represent the type of article source: orange for fact-checking and purple for low-credibility. The innermost sub-graph (d), where each node has degree k ≥ 50, corresponds to the main core. The heat maps show, for each core, the distribution of accounts in the space represented by two coordinates: the retweet ratio ρin and the fact-checking ratio ρf (see text).
Fig 7
Fig 7. Average fact-checking ratio as a function of the shell number k for activities of both primary spreading (‘out’) and secondary spreading (‘in’).
Error bars represent standard error.
Fig 8
Fig 8
Left: Change of main core number k with the evolution of the network. A rolling window of one week is applied to filter fluctuations. The shuffled version is obtained by sampling from the configuration model. This is repeated many times to obtain the 95% confidence interval shown in orange. The inset shows the size of the main core over time. Right: Churn rate (relative monthly change) of accounts in the main core.
Fig 9
Fig 9. Retweet network of the stable main core of spreaders of article from low-credibility sources.
Filtering by in-degree was applied to focus on the 34 accounts that retweet the most other accounts in the core. Node size represents out-degree (number of retweeters) and node color represents in-degree.
Fig 10
Fig 10. Average bot score for a random sample of accounts drawn from different k-shells of the pre-Election Day retweet network, as a function of k.
Only retweets including links to sources of misinformation are considered. Error bars represent standard errors.
Fig 11
Fig 11
Left: Distribution of sin and sout. Right: The average rank of users in the main core according to each centrality metric. Error bars represent standard errors.
Fig 12
Fig 12
Left: Fraction of the retweets remaining vs. number of spreaders disconnected in the network. Right: Fraction of unique article links remaining vs. number of spreaders disconnected in the network. The priority of disconnected users is determined by ranking on the basis of different centrality metrics.

References

    1. Barthel M, Mitchell A, Holcomb J. Many Americans Believe Fake News Is Sowing Confusion; 2016. Available from: http://www.journalism.org/2016/12/15/many-americans-believe-fake-news-is....
    1. Gottfried J, Shearer E. News Use Across Social Media Platforms 2017; 2017. Available from: http://www.journalism.org/2017/09/07/news-use-across-social-media-platfo....
    1. Barthel M, Mitchell A. Americans’ Attitudes About the News Media Deeply Divided Along Partisan Lines; 2017. Available from: http://www.journalism.org/2017/05/10/americans-attitudes-about-the-news-....
    1. Ratkiewicz J, Conover M, Meiss M, Gonçalves B, Patil S, Flammini A, et al. Truthy: Mapping the Spread of Astroturf in Microblog Streams. In: Proceedings of the 20th International Conference Companion on World Wide Web. WWW’11. New York, NY, USA: ACM; 2011. p. 249–252. Available from: http://doi.acm.org/10.1145/1963192.1963301. - DOI
    1. Xiang W, Zhilin Z, Xiang Y, Yan J, Bin Z, Shasha L. Finding the hidden hands: a case study of detecting organized posters and promoters in SINA weibo. China Communications. 2015;12(11):1–13. doi: 10.1109/CC.2015.7366237 - DOI

Publication types