

Ginkgo biloba's footprint of dynamic Pleistocene history dates back only 390,000 years ago
- PMID: 29703145
- PMCID: PMC5921299
- DOI: 10.1186/s12864-018-4673-2
Ginkgo biloba's footprint of dynamic Pleistocene history dates back only 390,000 years ago
Abstract
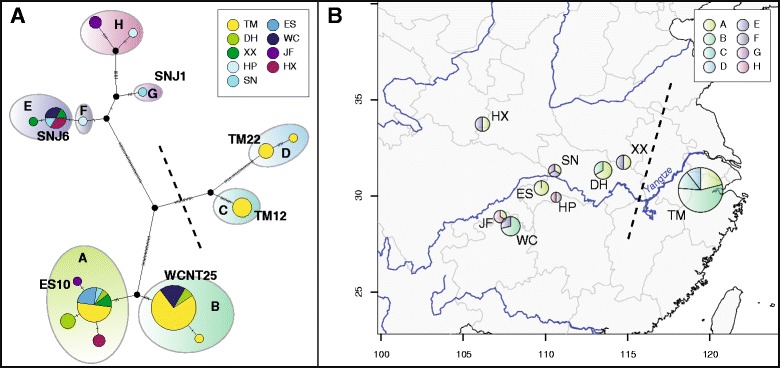
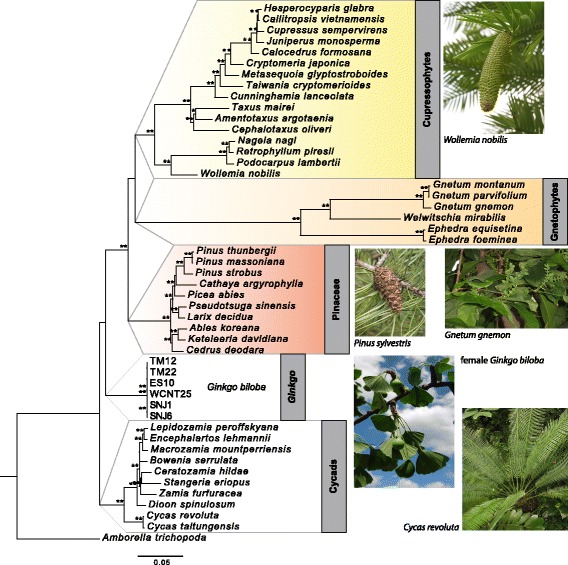
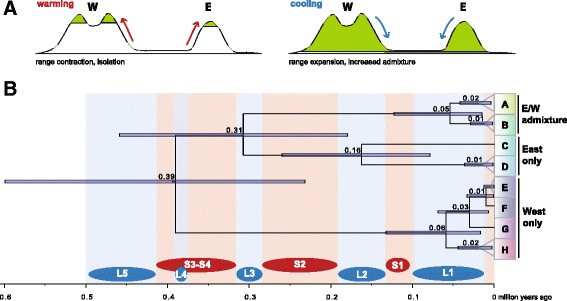
Background: At the end of the Pliocene and the beginning of Pleistocene glaciation and deglaciation cycles Ginkgo biloba went extinct all over the world, and only few populations remained in China in relict areas serving as sanctuary for Tertiary relict trees. Yet the status of these regions as refuge areas with naturally existing populations has been proven not earlier than one decade ago. Herein we elaborated the hypothesis that during the Pleistocene cooling periods G. biloba expanded its distribution range in China repeatedly. Whole plastid genomes were sequenced, assembled and annotated, and sequence data was analyzed in a phylogenetic framework of the entire gymnosperms to establish a robust spatio-temporal framework for gymnosperms and in particular for G. biloba Pleistocene evolutionary history.
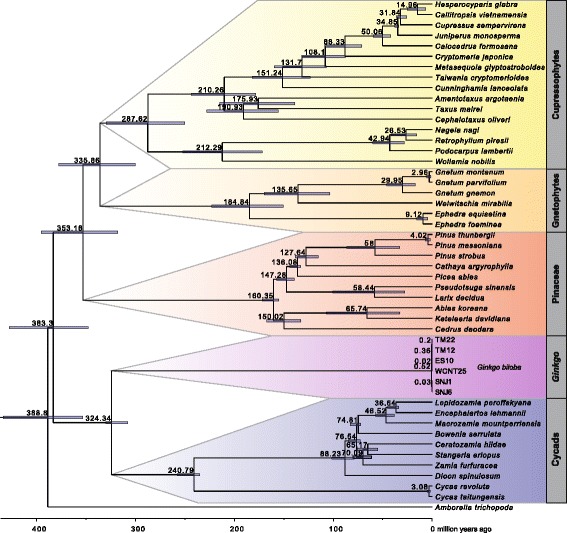
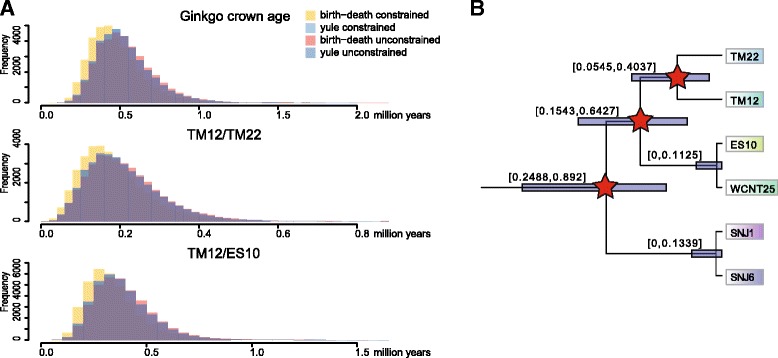
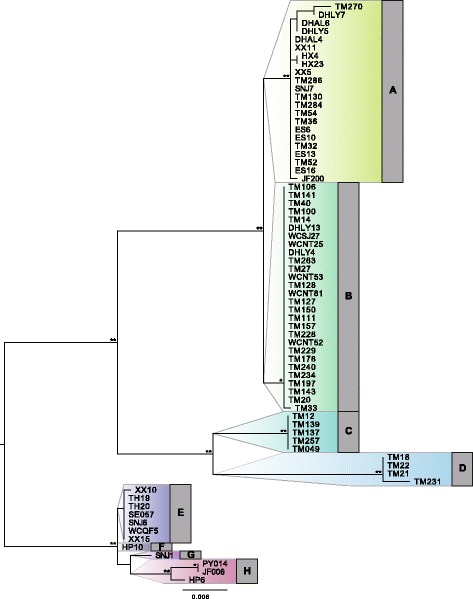
Results: Using a phylogenetic approach, we identified that Ginkgoatae stem group age is about 325 million years, whereas crown group radiation of extant Ginkgo started not earlier than 390,000 years ago. During repeated warming phases, Gingko populations were separated and isolated by contraction of distribution range and retreated into mountainous regions serving as refuge for warm-temperate deciduous forests. Diversification and phylogenetic splits correlate with the onset of cooling phases when Ginkgo expanded its distribution range and gene pools merged.
Conclusions: Analysis of whole plastid genome sequence data representing the entire spatio-temporal genetic variation of wild extant Ginkgo populations revealed the deepest temporal footprint dating back to approximately 390,000 years ago. Present-day directional West-East admixture of genetic diversity is shown to be the result of pronounced effects of the last cooling period. Our evolutionary framework will serve as a conceptual roadmap for forthcoming genomic sequence data, which can then provide deep insights into the demographic history of Ginkgo.
Keywords: Evolutionary history; Ginkgo biloba; Phylogenomics; Pleistocene.
Conflict of interest statement
Competing interest
The authors declare that they have no competing interests.
Publisher’s Note
Springer Nature remains neutral with regard to jurisdictional claims in published maps and institutional affiliations.
Figures

Similar articles
-
Phylogeography of a living fossil: pleistocene glaciations forced Ginkgo biloba L. (Ginkgoaceae) into two refuge areas in China with limited subsequent postglacial expansion.Mol Phylogenet Evol. 2008 Sep;48(3):1094-105. doi: 10.1016/j.ympev.2008.05.003. Epub 2008 May 11. Mol Phylogenet Evol. 2008. PMID: 18554931
-
An Arabidopsis introgression zone studied at high spatio-temporal resolution: interglacial and multiple genetic contact exemplified using whole nuclear and plastid genomes.BMC Genomics. 2017 Oct 23;18(1):810. doi: 10.1186/s12864-017-4220-6. BMC Genomics. 2017. PMID: 29058582 Free PMC article.
-
Evidence for the persistence of wild Ginkgo biloba (Ginkgoaceae) populations in the Dalou Mountains, southwestern China.Am J Bot. 2012 Aug;99(8):1408-14. doi: 10.3732/ajb.1200168. Epub 2012 Jul 30. Am J Bot. 2012. PMID: 22847538
-
Resequencing 545 ginkgo genomes across the world reveals the evolutionary history of the living fossil.Nat Commun. 2019 Sep 13;10(1):4201. doi: 10.1038/s41467-019-12133-5. Nat Commun. 2019. PMID: 31519986 Free PMC article.
-
EST analysis in Ginkgo biloba: an assessment of conserved developmental regulators and gymnosperm specific genes.BMC Genomics. 2005 Oct 15;6:143. doi: 10.1186/1471-2164-6-143. BMC Genomics. 2005. PMID: 16225698 Free PMC article.
Cited by
-
Phylogenomics indicates the "living fossil" Isoetes diversified in the Cenozoic.PLoS One. 2020 Jun 18;15(6):e0227525. doi: 10.1371/journal.pone.0227525. eCollection 2020. PLoS One. 2020. PMID: 32555586 Free PMC article.
-
Landscape Features and Climatic Forces Shape the Genetic Structure and Evolutionary History of an Oak Species (Quercus chenii) in East China.Front Plant Sci. 2019 Sep 3;10:1060. doi: 10.3389/fpls.2019.01060. eCollection 2019. Front Plant Sci. 2019. PMID: 31552065 Free PMC article.
-
Genomic divergence and demographic history of Quercus aliena populations.BMC Plant Biol. 2024 Jan 9;24(1):39. doi: 10.1186/s12870-023-04623-y. BMC Plant Biol. 2024. PMID: 38195447 Free PMC article.
-
Population dynamics linked to glacial cycles in Cercis chuniana F. P. Metcalf (Fabaceae) endemic to the montane regions of subtropical China.Evol Appl. 2021 Oct 7;14(11):2647-2663. doi: 10.1111/eva.13301. eCollection 2021 Nov. Evol Appl. 2021. PMID: 34815745 Free PMC article.
-
The evolutionary history of Cardamine bulbifera shows a successful rapid postglacial Eurasian range expansion in the absence of sexual reproduction.Ann Bot. 2022 Sep 6;130(2):245-263. doi: 10.1093/aob/mcac088. Ann Bot. 2022. PMID: 35789248 Free PMC article.
References
-
- Uemura K. Cenozoic history of Ginkgo in East Asia. In: Hori T, Ridge RW, Tulecke W, Del Tredici P, Trémouillaux-Guiller J, Tobe H, editors. Ginkgo Biloba Glob Treasure Biol Med. Tokyo: Springer Japan; 1997. pp. 207–221.
-
- Zhou Z-Y. An overview of fossil Ginkgoales. Palaeoworld. 2009;18:1–22. doi: 10.1016/j.palwor.2009.01.001. - DOI
-
- Gong W, Chen C, Dobeš C, Fu C-X, Koch MA. Phylogeography of a living fossil: Pleistocene glaciations forced Ginkgo biloba L. (Ginkgoaceae) into two refuge areas in China with limited subsequent postglacial expansion. Mol Phylogenet Evol. 2008;48:1094–1105. doi: 10.1016/j.ympev.2008.05.003. - DOI - PubMed
-
- Zhao Y, Paule J, Fu C, Koch MA. Out of China: distribution history of Ginkgo biloba L. Taxon. 2010;59:495–504.
MeSH terms
Grants and funding
LinkOut - more resources
Full Text Sources
Other Literature Sources
Molecular Biology Databases
