. 2018 Apr 27;37(1):91.
doi: 10.1186/s13046-018-0760-0.

Bortezomib enhances radiosensitivity in oral cancer through inducing autophagy-mediated TRAF6 oncoprotein degradation

Affiliations

Bortezomib enhances radiosensitivity in oral cancer through inducing autophagy-mediated TRAF6 oncoprotein degradation

Yuan-Hua Wu et al. J Exp Clin Cancer Res. .

Abstract

Background: Oral squamous cell carcinoma (OSCC) is a malignant tumor that may occur anywhere within the oral cavity. The survival rate of OSCC patients has not improved over the past decades due to its heterogeneous etiology, genetic aberrations, and treatment outcomes. We investigated the role of tumor necrosis factor receptor-associated factor 6 (TRAF6) in OSCC cells treated with bortezomib (a proteasome inhibitor) combined with irradiation (IR) treatment.

Methods: The effects of combined treatment in OSCC cells were investigated using assays of cell viability, autophagy, apoptosis, western blotting, and immunofluorescence staining. The ubiquitination of proteins was analyzed by immunoprecipitation. Stable knockdown of TRAF6 in OSCC cells was constructed with lentivirus. The xenograft murine models were used to observe tumor growth.

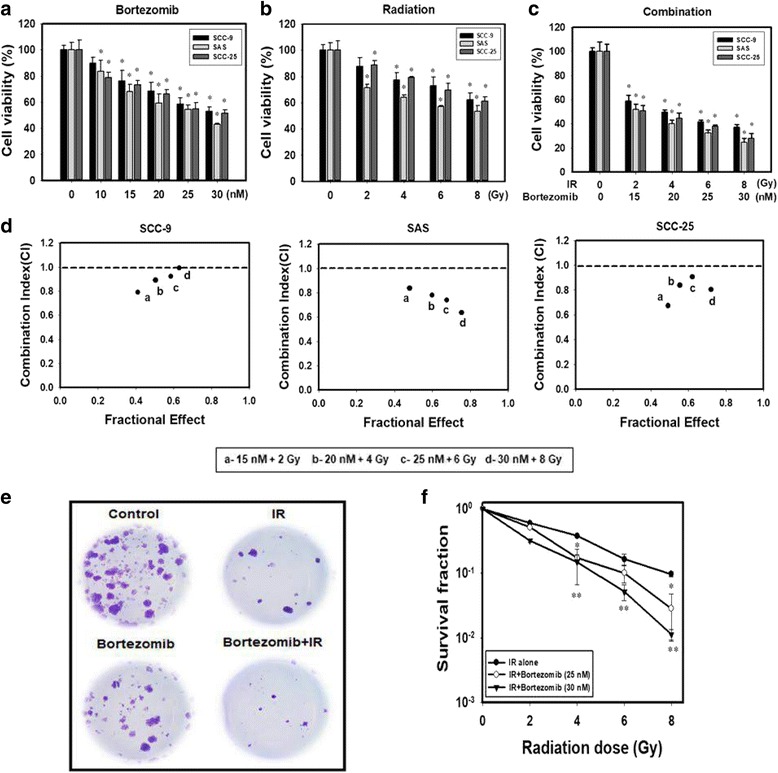
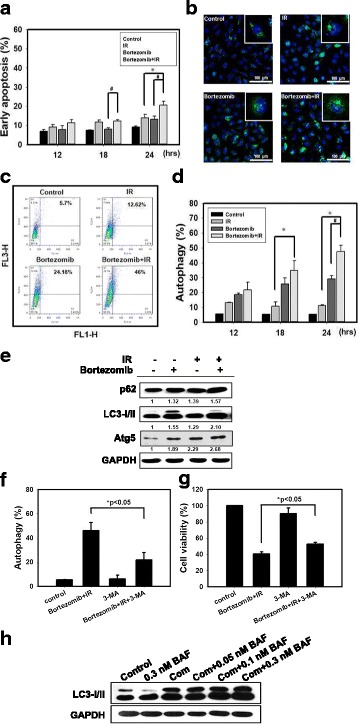
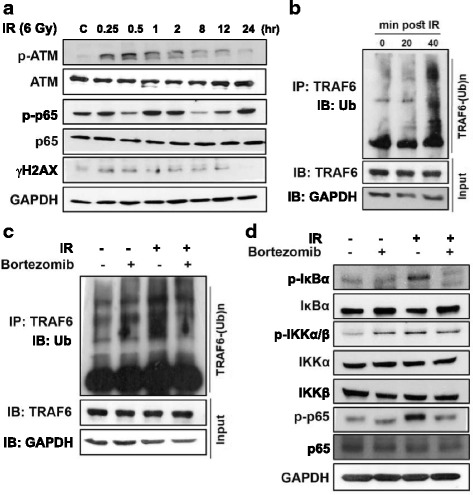
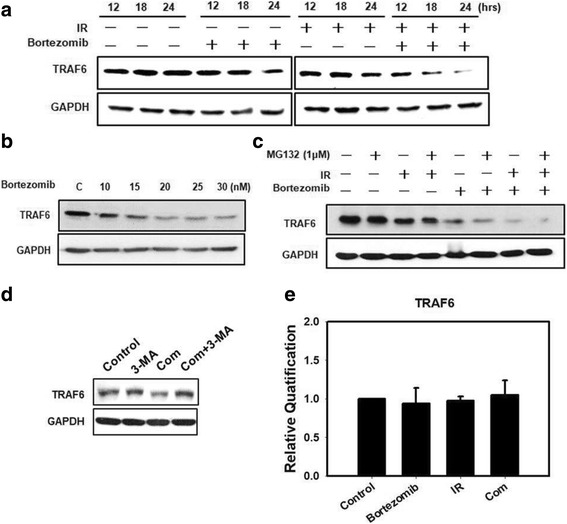
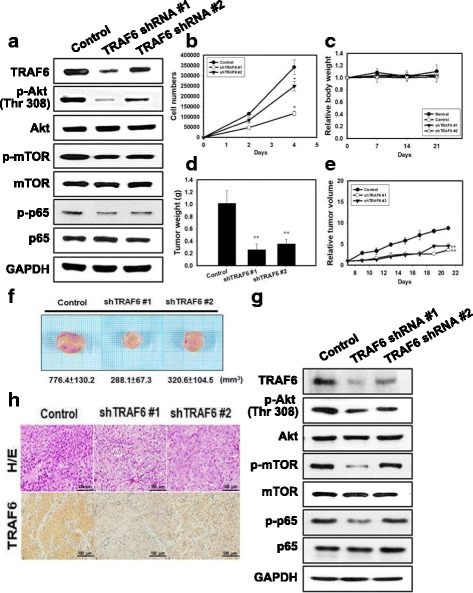
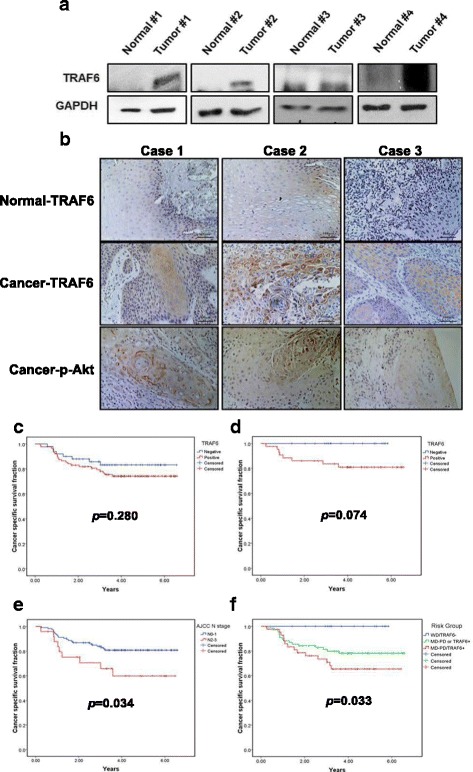
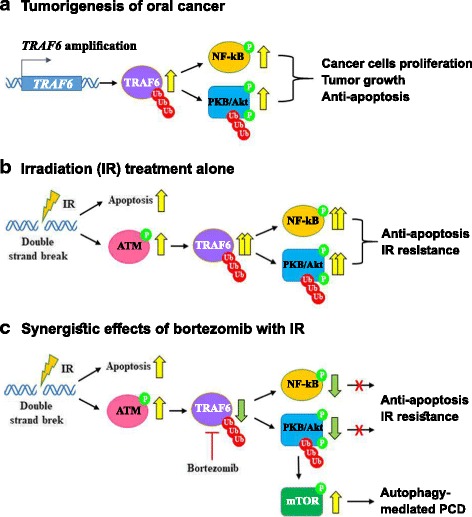
Results: We found synergistic effects of bortezomib and IR on the viability of human oral cancer cells. The combination of bortezomib and IR treatment induced autophagic cell death. Furthermore, bortezomib inhibited IR-induced TRAF6 ubiquitination and inhibited TRAF6-mediated Akt activation. Bortezomib reduced TRAF6 protein expression through autophagy-mediated lysosomal degradation. TRAF6 played an oncogenic role in tumorigenesis of human oral cancer cells and oral tumor growth was suppressed by bortezomib and IR treatment. In addition, OSCC patients with expression of TRAF6 showed a trend towards poorer cancer-specific survival when compared with patients without TRAF6 expression.

Conclusions: A combination of a proteasome inhibitor, IR treatment and TRAF6 inhibition could be a novel therapeutic strategy in OSCC.

Keywords: Autophagy; Oral squamous cell carcinoma; Radiation; TRAF6; Ubiquitination.


Conflict of interest statement

Ethics approval and consent to participate

Clinical tissues were collected from patients who received curative surgery for oral squamous cell carcinoma at National Cheng Kung University Hospital, Taiwan. All experiments on mice were performed according to the guidelines of our institute (the Guide for Care and Use of Laboratory Animals, National Cheng Kung University). The animal use protocol listed below has been reviewed and approved by the Institutional Animal Care and Use Committee (IACUC) (Approval No: 99138).

Competing interests

The authors declare that they have no competing interests.

Publisher’s Note

Springer Nature remains neutral with regard to jurisdictional claims in published maps and institutional affiliations.

Figures

Fig. 1
Fig. 1
Synergistic effects of bortezomib and IR on the viability of human oral cancer cells. a Concentration-dependent effects of bortezomib on the cell viability of SCC-9, SAS and SCC-25 cells. Cells were treated with 0, 10, 15, 20, 25 or 30 nM of bortezomib for 24 h. *p < 0.05, control versus bortezomib. b Dose-dependent effects of IR on cell viability of SCC-9, SAS and SCC-25 cells. Cells were treated with 0, 2, 4, 6, or 8 Gy of IR for 24 h. *p < 0.05, control versus IR. c Dose-dependent effects of bortezomib combined with IR on cell viability of SCC-9, SAS and SCC-25 cells. *p < 0.05, control versus IR + bortezomib. d Combination index (CI) plot of bortezomib, IR, or their combinations on SCC-9, SAS and SCC-25 cells. e Bortezomib decreases the clonogenic survival in SAS cells after IR treatment. Cells were stained with crystal violet. f Colonies containing> 50 cells were scored as positive. Data are presented as the mean ± standard deviation from three independent experiments. *p < 0.05, IR versus IR + bortezomib (25 nM), **p < 0.05, IR versus IR + bortezomib (30 nM)
Fig. 2
Fig. 2
Bortezomib and IR induce autophagy in SAS cells. a Measurement of early apoptosis in SAS cells. Early apoptosis detection was measured by flow cytometry with an Annexin V apoptosis detection kit. Cells were treated with 6 Gy of IR or 25 nM of bortezomib for 12, 18, and 24 h. # p < 0.05, bortezomib versus IR + bortezomib. * p < 0.05, IR versus IR + bortezomib. b Confocal immunofluorescence microscopy of LC3 following 24 h treatment with 6 Gy of IR and 25 nM of bortezomib alone or in combination. c Measurement of autophagy in SAS cells. Detection of green and red fluorescence in acridine orange-stained cells using flow cytometry. SAS cells were treated with IR (6 Gy) and bortezomib (25 nM) alone or in combination for 24 h. d Quantification of AVOs with acridine orange using flow cytometry. Cells were treated with 6 Gy of IR or 25 nM of bortezomib alone or in combination for 12, 18 and 24 h. # p < 0.05, bortezomib versus IR + bortezomib. * p < 0.05, IR versus IR + bortezomib. e Western blot analysis of autophagy-related proteins expression in SAS cells. Cells were treated with 6 Gy of IR and 25 nM of bortezomib alone or in combination for 24 h. f Measurement by flow cytometry with AVOs in the absence or presence of 3-methyladenine (3-MA). Cells were pretreated with 3-MA (2 mM) for 1 h before combined treatment (6 Gy of IR and 25 nM of bortezomib) for 24 h. g Cytotoxic effects in the absence or presence of 3-MA for 24 h. h Western blot analysis of LC3 expression in the absence or presence of bafilomycin A1 (BAF). Cells were pretreated with BAF for 1 h before combined treatment (6 Gy of IR and 25 nM of bortezomib) for 24 h. *p < 0.05, IR + bortezomib + 3-MA versus IR + bortezomib
Fig. 3
Fig. 3
Bortezomib inhibits activation of TRAF6 and NF-κB activity. a After the cells were exposed to IR, they were collected and lysed. The expression of phosphorylated ATM, p65 and γH2AX were examined by Western blot analysis. b SAS cells were treated with IR, lysed at the times indicated (min), and immunoprecipitated with TRAF6 antibody. IP extracts were analyzed for ubiquitin (Ub) or TRAF6 by immunoblotting. c Bortezomib suppressed TRAF6-mediated polyubiquitination by IR. Cells were treated with IR and bortezomib alone or in combination. Cells were treated with 6 Gy of IR or 25 nM of bortezomib for 40 min. d Bortezomib inhibited the activation of NF-κB induced by IR. Cells were treated with IR and bortezomib alone or in combination. Cells were treated with 6 Gy of IR or 25 nM of bortezomib for 1 h
Fig. 4
Fig. 4
Bortezomib reduces TRAF6 protein expression through autophagy-mediated lysosomal degradation. a Western blot analysis of TRAF6 protein expression in SAS cells. Cells were treated with 6 Gy of IR or 25 nM of bortezomib or in combination for 12, 18 and 24 h. b Western blot analysis of TRAF6 protein expression in SAS cells. The cells were treated with bortezomib alone with 10, 15, 20, 25, or 30 nM of bortezomib for 24 h. c Western blot analysis of TRAF6 protein expression in SAS cells. Cells were treated with 6 Gy of IR or 25 nM of bortezomib or 1 μM of MG132 or in combination for 24 h. d Western blot analysis of TRAF6 protein expression in the absence or presence of 3-MA. Cells were pretreated with 3-MA (2 mM) for 1 h before combined treatment (6 Gy of IR and 25 nM of bortezomib) for 24 h. e TRAF6 mRNA expression levels were measured by real-time RT-PCR in the indicated cell lines and SAS cells treated with 6 Gy of IR or 25 nM of bortezomib alone or in combination for 24 h
Fig. 5
Fig. 5
TRAF6 plays an oncogenic role in tumorigenesis of human oral cancer cells in vivo. a TRAF6-Akt signaling pathway and p-p65 protein expression in SAS cells transfected with TRAF6 shRNA. b Cell growth curve resulting from TRAF6 shRNA in SAS cells. *p < 0.05, versus control. c Measurement of body weight in NOD/SCID mice once per week. d Measurement of tumor weight of SAS xenograft in NOD/SCID mice. e SAS xenograft tumor growth curves in NOD/SCID nude mice. SAS cells silenced with TRAF6 shRNAs were injected into nude mice (n = 5 for each group) and monitored for tumorigenesis. ** p < 0.01 versus untreated controls. f Direct observation of mice with tumors from the control and TRAF6 shRNAs groups. g Analysis of the TRAF6-Akt signaling pathway related proteins from tumors transfected with TRAF6 shRNA and grown in NOD/SCID mice by western blot, and (h) H/E staining and immunohistochemical staining for analysis of TRAF6-positive cells (brown)
Fig. 6
Fig. 6
The expression of TRAF6 was elevated in OSCC patients. a The protein level of TRAF6 in OSCC samples and paired normal tissues was analyzed by Western blot. b The protein level of TRAF6 in human OSCC samples and paired normal tissues was analyzed by IHC. Cancer-specific survival by the Kaplan-Meier method by (c) the expression of TRAF6 in all patients (p = 0.280), (d) the expression of TRAF6 in patients with well differentiated tumors (N = 60; p = 0.074), (e) AJCC N stage (N0–1 vs. N2–3) (p = 0.034), and (f) Risk groups stratified by differentiation and expression of TRAF6 (p = 0.033)
Fig. 7
Fig. 7
The role of TRAF6 in OSCC cells treated with combined bortezomib and IR treatment. a TRAF6-mediated polyubiquitination causes cell proliferation, tumor growth and anti-apoptosis during tumorigenesis of oral cancer. b IR treatment alone induces apoptosis. However, IR also induces phosphorylation of ATM and then increases TRAF6 polyubiquitination and phosphorylation of NF-kB, eventually leading to anti-apoptosis and IR resistance. c Bortezomib inhibits IR-induced TRAF6 polyubiquitination. Furthermore, bortezomib inhibits TRAF6-mediated Akt activation and induces autophagy-mediated programmed cell death (PCD)

References

    1. Petersen PE. Oral cancer prevention and control--the approach of the World Health Organization. Oral Oncol. 2009;45:454–460. doi: 10.1016/j.oraloncology.2008.05.023. - DOI - PubMed
    1. Petruzzi MN, Cherubini K, Salum FG, de Figueiredo MA. Role of tumour-associated macrophages in oral squamous cells carcinoma progression: an update on current knowledge. Diagn Pathol. 2017;12:32. doi: 10.1186/s13000-017-0623-6. - DOI - PMC - PubMed
    1. Montagnani F, Fornaro L, Frumento P, Vivaldi C, Falcone A, Fioretto L. Multimodality treatment of locally advanced squamous cell carcinoma of the oesophagus: a comprehensive review and network meta-analysis. Crit Rev Oncol Hematol. 2017;114:24–32. doi: 10.1016/j.critrevonc.2017.03.024. - DOI - PubMed
    1. Lo Nigro C, Denaro N, Merlotti A, Merlano M. Head and neck cancer: improving outcomes with a multidisciplinary approach. Cancer Manag Res. 2017;9:363–371. doi: 10.2147/CMAR.S115761. - DOI - PMC - PubMed
    1. Manasanch EE, Orlowski RZ. Proteasome inhibitors in cancer therapy. Nat Rev Clin Oncol. 2017;14:417–433. doi: 10.1038/nrclinonc.2016.206. - DOI - PMC - PubMed

MeSH terms