. 2018 Jul;24(7):950-965.
doi: 10.1261/rna.064493.117. Epub 2018 Apr 27.

Simultaneous sequencing of coding and noncoding RNA reveals a human transcriptome dominated by a small number of highly expressed noncoding genes

Affiliations

Simultaneous sequencing of coding and noncoding RNA reveals a human transcriptome dominated by a small number of highly expressed noncoding genes

Vincent Boivin et al. RNA. 2018 Jul.

Abstract

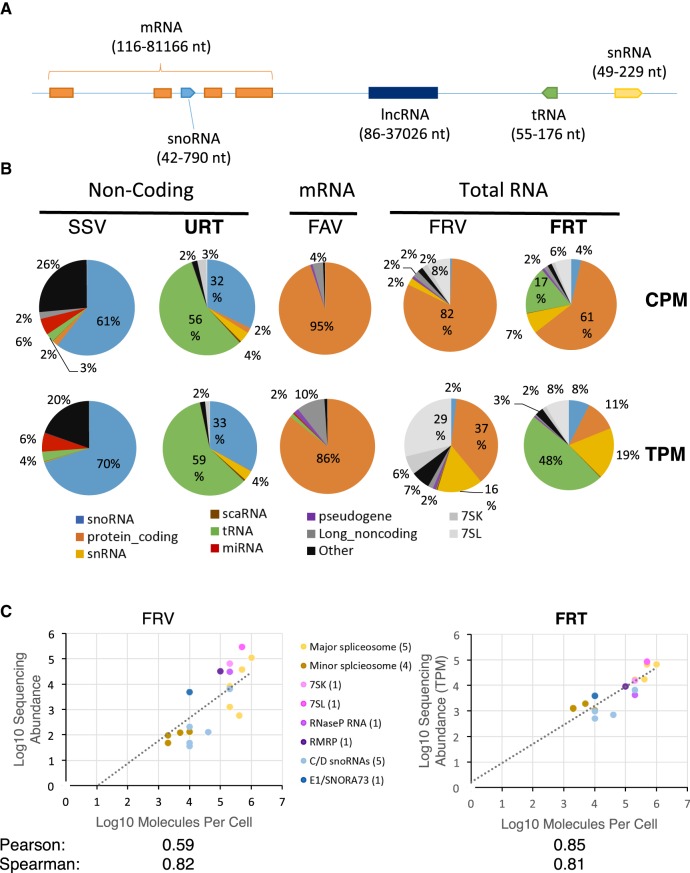
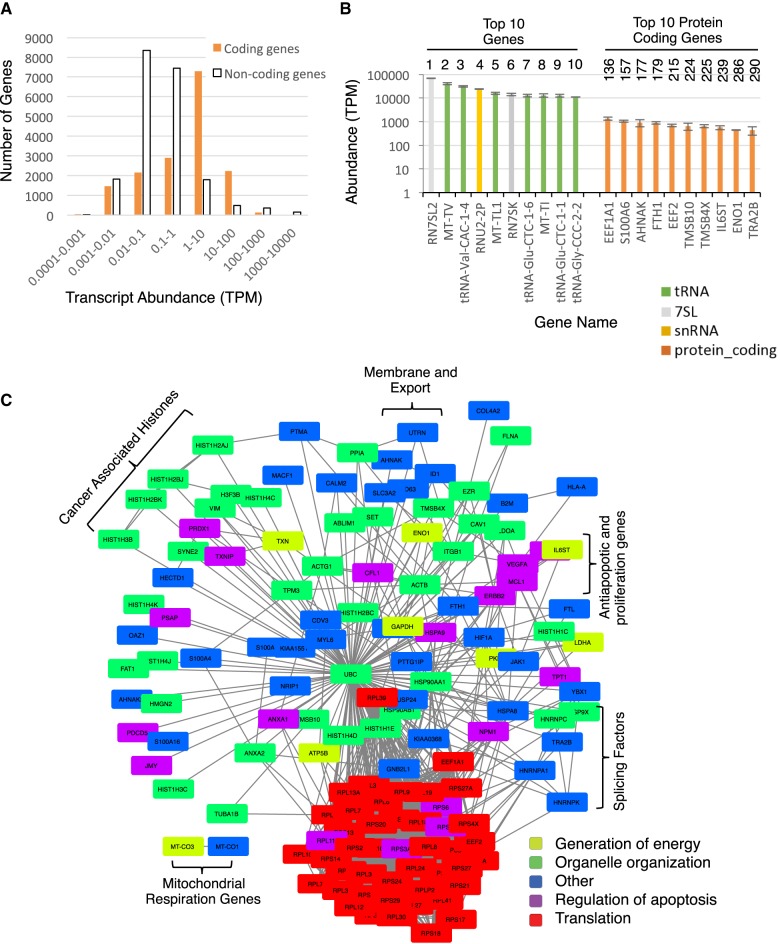
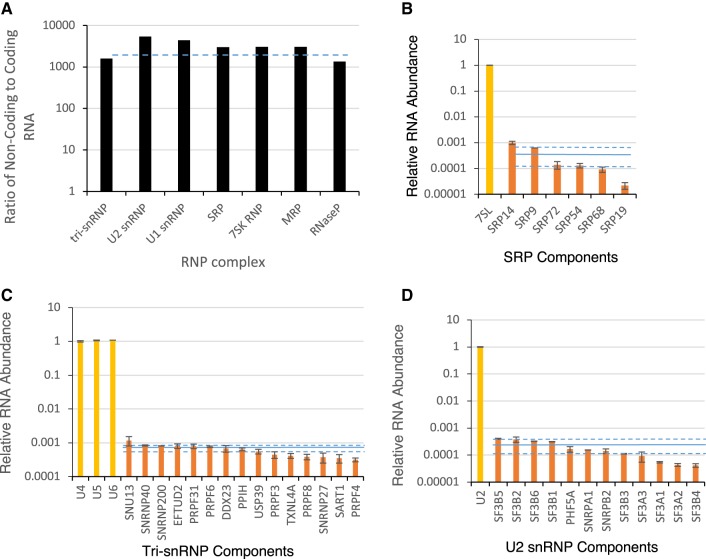
Comparing the abundance of one RNA molecule to another is crucial for understanding cellular functions but most sequencing techniques can target only specific subsets of RNA. In this study, we used a new fragmented ribodepleted TGIRT sequencing method that uses a thermostable group II intron reverse transcriptase (TGIRT) to generate a portrait of the human transcriptome depicting the quantitative relationship of all classes of nonribosomal RNA longer than 60 nt. Comparison between different sequencing methods indicated that FRT is more accurate in ranking both mRNA and noncoding RNA than viral reverse transcriptase-based sequencing methods, even those that specifically target these species. Measurements of RNA abundance in different cell lines using this method correlate with biochemical estimates, confirming tRNA as the most abundant nonribosomal RNA biotype. However, the single most abundant transcript is 7SL RNA, a component of the signal recognition particle. Structured noncoding RNAs (sncRNAs) associated with the same biological process are expressed at similar levels, with the exception of RNAs with multiple functions like U1 snRNA. In general, sncRNAs forming RNPs are hundreds to thousands of times more abundant than their mRNA counterparts. Surprisingly, only 50 sncRNA genes produce half of the non-rRNA transcripts detected in two different cell lines. Together the results indicate that the human transcriptome is dominated by a small number of highly expressed sncRNAs specializing in functions related to translation and splicing.

Keywords: RNA detection; high-throughput sequencing; noncoding RNA; snoRNA; thermostable group II intron reverse transcriptase; transcriptome analysis.


Figures

FIGURE 1.
FIGURE 1.
Sequencing methods permitting simultaneous detection of transcripts with different sizes and structures reveal a human transcriptome dominated by noncoding RNA. (A) Schematic of the human genome illustrating the predicted size distribution of different classes of RNA (size range based on Ensembl annotations shown in parentheses). (B) Distribution of RNA in the human transcriptome as detected by different sequencing methods. The RNA was extracted from the ovarian cancer model cell line SKOV3ip1 and subjected to different sequencing protocols using different RNA selection methods and reverse transcriptases including size-selected viral reverse transcriptase sequencing (SSV), unfragmented, ribodepleted RNA TGIRT-seq (URT), fragmented poly(A) selected viral reverse transcriptase sequencing (FAV), fragmented ribodepleted viral reverse transcriptase sequencing (FRV), fragmented ribodepleted RNA TGIRT-seq (FRT). The intended target of the different methods is indicated above the method names. The results are shown in the form of pie charts illustrating the distribution of RNA abundance in counts per million (CPM) or transcripts per million (TPM). The results are the average of two biological replicates. The percentage of the main classes (≥2%) is indicated. The color legend for the different RNA classes is shown at the bottom. (C) Comparison between the capacity of viral and group II intron-encoded RTs to predict the abundance of noncoding RNA. The noncoding RNA abundance obtained by the viral RT- or TGIRT-based sequencing methods FRV or FRT was plotted against established estimates of the number of molecules per cell for each biotype (Tycowski et al. 2006). Pearson and Spearman coefficients are indicated at bottom. A legend of the different classes of noncoding RNA and the number of genes considered from each type tested is shown in the middle.
FIGURE 2.
FIGURE 2.
The composition of the human transcriptome is dominated by a small subset of highly expressed noncoding RNA genes and a large number of moderately expressed protein-coding genes reflecting cellular phenotypes. (A) The abundance of both coding and noncoding gene transcripts was determined using FRT, separated into bins based on transcript abundance, and the number of genes per bin illustrated in the form of a bar graph. (B) The genes producing the top 10 overall most abundant RNAs and the top 10 most abundant protein-coding RNAs are shown as a bar graph. The rank of each transcript based on abundance in transcript per million (TPM) is indicated on top. (C) Interaction map of the most expressed protein-coding genes in the model ovarian cancer cell line SKOV3ip1. Genes producing RNAs with more than 100 TPM were identified, and their functional, genetic, and physical interactions obtained from STRING (Szklarczyk et al. 2015) and illustrated as an interaction network. The main gene ontology annotations for the genes are indicated at bottom right (also see Supplemental Table S6). Open brackets indicate examples of complexes associated with cancer phenotypes and other established phenotypes of SKOV3ip1 cells.
FIGURE 3.
FIGURE 3.
Major ribonucleoprotein complexes are generated from mostly uniformly abundant populations of protein-coding transcripts and highly abundant noncoding RNAs. (A) The ratio of the noncoding and coding RNAs associated with seven established ribonucleoprotein complexes as determined using FRT are illustrated in the form of a bar chart. The dashed line indicates the average ratio of noncoding to coding RNA, which is approximately 3000:1. The abundance of mRNAs coding for key protein components of SRP (B), tri-snRNP (C), and U2 snRNP (D) complexes are plotted as a fraction of their respective noncoding RNA. The solid line indicates the average abundance level of the protein-coding RNA of the complex, and the dashed lines indicate 5% and 95% confidence intervals. The standard deviation of two biological replicates is indicated in the form of error bars.
FIGURE 4.
FIGURE 4.
The abundance of snoRNAs relative to the host mRNA in which they are encoded depends on the type of snoRNA and the function of the host genes. (A,B) Scatter plots illustrating the relationship between the abundance of box C/D (A) and H/ACA (B) snoRNAs and the protein-coding RNA produced from their host genes, as determined by FRT. The function of the different host genes is indicated in the legend at the bottom. RP indicates ribosomal protein. The dashed boxes indicate area with the most visible difference between C/D and H/ACA snoRNA.
FIGURE 5.
FIGURE 5.
The abundance of snoRNAs correlates with their function. (A) Distribution of snoRNA by target type. The proportion of expressed box C/D snoRNAs (dark gray) and box H/ACA (light gray) targeting rRNA, snRNA, or no known target (orphan) is indicated in the form of a bar graph. (B) Box plot displaying the distribution of abundance of both box C/D (dark gray) and H/ACA (light gray) snoRNAs as a function of their target type. The abundance of snoRNAs targeting the 28S rRNA, 18S rRNA, snRNA, and those with no known target (orphan) were identified using FRT and the average value of two biological replicates plotted, with the solid line indicating the median value. (C) Position of the 28S rRNA modification sites targeted by the most abundant snoRNA. The 28S methylated or pseudouridylated residues were binned according to their position in the molecule, counted, and then their proportion plotted as a bar graph. The white bars indicate the proportion of all known modified residues found at the indicated position, while the gray bars indicate the proportion of those residues modified by the most abundant snoRNA (>1000 TPM) as determined by FRT. (D) Position of the 28S (top) and 18S (bottom) rRNA modification sites targeted by the most abundant snoRNA. (E) Three-dimensional model of the ribosome featuring the modification sites targeted by the most abundant snoRNA. The model was generated by the 3D rRNA modification maps database tool kit (Piekna-Przybylska et al. 2008). The rRNA is shown in dark gray for the 28S large subunit rRNA and light gray for the 18S small subunit rRNA. A tRNA is shown in the A (light blue), P (purple), and E (pink) sites and the approximate position of the mRNA and nascent peptide are indicated in blue and orange, respectively. The pseudouridylation and methylation sites targeted by the most abundant snoRNAs are shown in red and green, respectively. The position of the peptidyl transferase center (PTC) is indicated by the yellow circle.

References

    1. Abbas W, Kumar A, Herbein G. 2015. The eEF1A proteins: at the crossroads of oncogenesis, apoptosis, and viral infections. Front Oncol 5: 75. - PMC - PubMed
    1. Akopian D, Shen K, Zhang X, Shan SO. 2013. Signal recognition particle: an essential protein-targeting machine. Annu Rev Biochem 82: 693–721. - PMC - PubMed
    1. Arimbasseri AG, Rijal K, Maraia RJ. 2014. Comparative overview of RNA polymerase II and III transcription cycles, with focus on RNA polymerase III termination and reinitiation. Transcription 5: e27639. - PMC - PubMed
    1. Bai B, Laiho M. 2016. Deep sequencing analysis of nucleolar small RNAs: RNA isolation and library preparation. Methods Mol Biol 1455: 231–241. - PubMed
    1. Beck M, Schmidt A, Malmstroem J, Claassen M, Ori A, Szymborska A, Herzog F, Rinner O, Ellenberg J, Aebersold R. 2011. The quantitative proteome of a human cell line. Mol Syst Biol 7: 549. - PMC - PubMed

Publication types