. 2018 Apr 27;9(1):1700.
doi: 10.1038/s41467-018-03770-3.

Targeting of NAT10 enhances healthspan in a mouse model of human accelerated aging syndrome

Collaborators, Affiliations

Targeting of NAT10 enhances healthspan in a mouse model of human accelerated aging syndrome

Gabriel Balmus et al. Nat Commun. .

Abstract

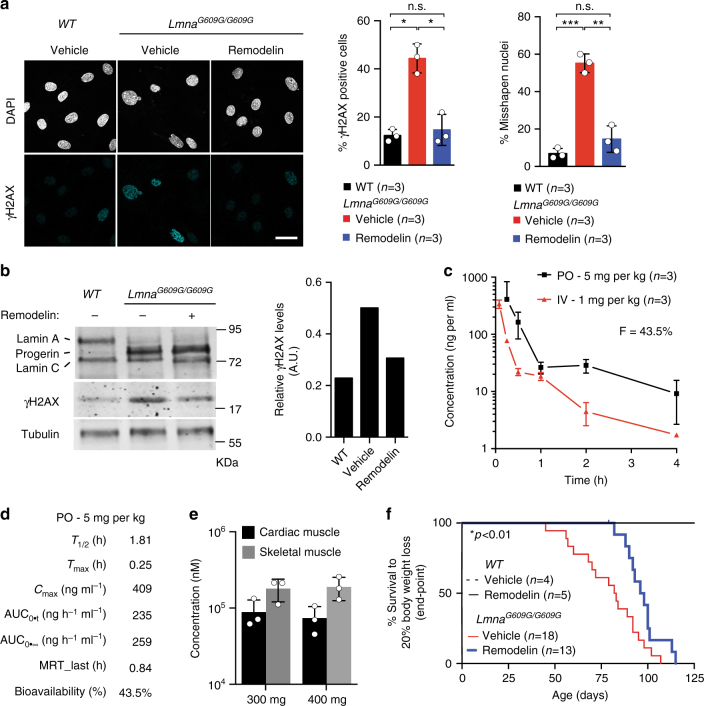
Hutchinson-Gilford Progeria Syndrome (HGPS) is a rare, but devastating genetic disease characterized by segmental premature aging, with cardiovascular disease being the main cause of death. Cells from HGPS patients accumulate progerin, a permanently farnesylated, toxic form of Lamin A, disrupting the nuclear shape and chromatin organization, leading to DNA-damage accumulation and senescence. Therapeutic approaches targeting farnesylation or aiming to reduce progerin levels have provided only partial health improvements. Recently, we identified Remodelin, a small-molecule agent that leads to amelioration of HGPS cellular defects through inhibition of the enzyme N-acetyltransferase 10 (NAT10). Here, we show the preclinical data demonstrating that targeting NAT10 in vivo, either via chemical inhibition or genetic depletion, significantly enhances the healthspan in a Lmna G609G HGPS mouse model. Collectively, the data provided here highlights NAT10 as a potential therapeutic target for HGPS.


Conflict of interest statement

D.L., S.P.J., and R.R. are named inventors on a patent describing compounds that include Remodelin. The remaining authors declare no competing interests.

Figures

Fig. 1
Fig. 1
Oral administration of Remodelin decreases weight loss in progeria mice. a, b Cells were treated with DMSO or with 1 µM Remodelin for 7 days. a Left: Representative immunofluorescence images of skin fibroblasts from LmnaG609G/G609G mice showing the accumulation of the DNA double-strand break marker gamma H2AX (γH2AX) ( blue) and characteristic nuclear shape abnormalities, observed by DAPI staining. All images were acquired with the same microscope intensity settings. Scale bar 20 µm. Right: Quantification of γH2AX positive cells and cells with misshapen nuclei (>100 cells/n = 3 independent cell lines; mean ± s.d.; n.s. not significant; *p < 0.05, **p < 0.01, ***p < 0.001, two-tailed Student’s t-test). b Western blotting analysis of γH2AX levels (quantified in the right panel) in skin fibroblasts from the indicated genotypes. c,d Pharmacokinetic analyses of Remodelin in mice treated via oral (PO; n = 3) or intravenous (IV; n = 3) delivery; mean ± s.e.m. F absolute bioavailability (%). e Tissues were collected after 2 weeks of daily PO administration of the indicated Remodelin concentration and 1 h after the last dosing. Remodelin was quantified by mass spectrometry in the heart and the skeletal muscle (n = 3); mean ± s.e.m. f Survival based on 20% body weight loss, showing a 25% increase in Kaplan–Meier area under the curve in Remodelin-treated LmnaG609G/G609G mice, as compared to vehicle-treated mice (see Supplementary Table 3); (*Log-rank Mantel-Cox test; Chi-square 5.992). Due to animal welfare regulations, mice had to be killed when they had lost 20% of their body weight, compared to their individual weight maxima (end-point). However, at this defined end-point, Remodelin-treated mice displayed considerably better health, compared to the vehicle-treated controls (see supplementary movies and pathology assessments in Fig. 2)
Fig. 2
Fig. 2
Remodelin ameliorates cardiac and other pathologies of HGPS mice. Pathological staining in panels ad was carried out on the materials from end-point mice (presented in Fig.  1f) of indicated genotypes (n = 6 per genotype) treated with vehicle or Remodelin 100 mg per kg per day (for detailed ages of the mice, see Supplementary Table 4). All images are representative (scale bar 50 µm) and the correspondent bar graph quantifications are presented (mean ± s.e.m.; individual data points represented; n.s. not significant; *p < 0.05, **p < 0.01, ***p < 0.001, ****p < 0.0001 two-tailed Student’s t-test). In WT mice, Remodelin treatment has no significant effect, as compared to vehicle treatment; and for simplicity these animals have been pooled in one group; the individual comparison is presented in Supplementary Fig. 2b. a Hematoxilin and eosin (H&E) staining of skin, indicating fat layer thickness (vertical bars indicate the fat layer) and showing amelioration of the fat layer thickness upon Remodelin treatment in HGPS mice. b H&E staining of heart aorta, indicating increased adventitial width in the HGPS mice, as compared to WT controls, which is rescued by Remodelin treatment (arrowheads demarcate the aorta and vertical bars the adventitia). c DAPI staining of heart aorta, showing a decreased number of nuclei in the HGPS mice, rescued by Remodelin treatment (dotted white lines delineate the aorta edges). d Smooth muscle actin (SMA) staining (green) of heart aorta sections, showing loss of integrity of the artery wall in HGPS mice, improved by Remodelin treatment (dotted white lines delineate the aorta). e, f Representative western blotting analysis of the representative heart (e) and lung (f) tissues from end-point mice, showing that Remodelin decreased γH2AX levels in LmnaG609G/G609G tissues (see quantification below each Western blot, relative to total H2AX levels). Western blots were performed more than once on n ≥ 4/group
Fig. 3
Fig. 3
Engineering and characterization of a Nat10+/− mouse model. a Number of observed embryos (E14.5) and mice (21 days), compared to the expected numbers (Mendelian frequencies) (*p < 0.01; Chi-square analysis). b, c Nat10+/− mice display ~50% reduction in Nat10 transcript level (b each bar indicates individual mice ± s.d. of n = 5 technical replicates/mouse) or protein expression in the indicated tissues (c representative western blot; blots have been performed more than once on n ≥ 3 mice), and the quantification is presented on the right panel, relative to actin levels. d Heatmap of genes differentially expressed in the heart of Nat10+/− mice, compared to the wild-type, from RNAseq analysis (n = 2/genotype)
Fig. 4
Fig. 4
Genetic depletion of Nat10 enhances the health of LmnaG609G mice. a LmnaG609G/G609GNat10+/− mice show a 21% increased median age at the end-point, compared to LmnaG609G/G609G (103 days vs. 85 days respective median age at end-point; based on the mice being terminated upon reaching 20% body weight loss); (**Log-rank, Mantel-Cox test; Chi-square 32.61; also see Supplementary 3). bd Appearance (b) of back curvature (c) in LmnaG609G/G609G mice is delayed by Nat10 depletion, as observed by images of terminal mice and X-rays from 9 week-old females, and quantified (kyphotic index) over time (d) (mean ± s.e.m.; individual data points represented; mixed model analysis shows a significant difference between LmnaG609G/G609GNat10+/+ and LmnaG609G/G609GNat10+/− genotypes **p = 0.01; raw data and extended conclusions and statistics are presented in Supplementary Data 3). e Progressive heart function failure observed in LmnaG609G/G609G mice over time is delayed by Nat10 depletion, as observed by the heart rate measurements at indicated times (mean ± s.e.m.; individual data points represented; mixed model analysis shows a significant difference between LmnaG609G/G609GNat10+/+ and LmnaG609G/G609GNat10+/− genotypes ***p = 0.004; raw data, extended conclusions, and statistics are presented in Supplementary Data 3). f RNA expression from heart tissues shows decreased p21 expression in LmnaG609G/G609GNat10+/−, compared to controls (mean ± s.e.m.; n.s. not significant, *p < 0.05 two-tailed Student’s t-test; individual data points represented). g Lmna+/G609GNat10+/− mice show a 17% increased median age at end-point, compared to Lmna+/G609G (333 days vs. 285 days respective median age at end-point; based on mice being terminated upon reaching a 20% body weight loss); (*Log-rank, Mantel-Cox test; Chi-square 4.98; also see Supplementary Table 3) and more than 90 days between the longest lived (20% body weight loss) Lmna+/G609GNat10+/− and the longest lived Lmna+/G609G mouse
Fig. 5
Fig. 5
Identification of potential readouts for Nat10 inhibition in cells and tissues. a,b Representative images of western blots showing that 1 µM Remodelin treatment for 7 days decreases the high alpha-Tubulin (α-tubulin) K40 acetylation in HGPS-patient derived cells (a) and mouse tissues (b). In panel b NAT10 chemical (lane 3) or genetic (lane 4) inhibition reverses the high α-tubulin K40 acetylation levels in heart tissues from indicated mice; *indicates a cross-reacting band. We note that the ratio between Lamin A and C appears to vary between tissues. All western blotting experiments were performed independently at least three times (n ≥ 3/genotype). c Representative immunofluorescence images of acetyl-α-tubulin K40 in HGPS-patient derived cells, as compared to matching healthy fibroblasts. Scale bar = 20 µm. The K40 α-tubulin acetylation (magenta) is increased in the HGPS-patient derived cells and decreased upon Remodelin treatment. d Representative immunofluorescence images (left) and quantification (right) of acetyl-α-tubulin K40 in aortas of terminal mice of the indicated genotypes and treatments. Scale bar = 10 µm. The K40 α-tubulin acetylation (green; white arrowheads point to example of cells that show increased K40 acetylation) is increased in LmnaG609G/G609G mice and significantly decreased in such mice, upon Remodelin treatment (n = 3; mean ± s.d.; individual data points represented; n.s. not significant, *p < 0.05; **p < 0.01, ***p < 0.001; two-tailed Student’s t-test). For better visualization, these are higher magnification snapshots (red dotted squares) from images in Supplementary Fig. 9d. Quantification was performed on full size aorta images from n = 3 independent mice

References

    1. Osmanagic-Myers S, Dechat T, Foisner R. Lamins at the crossroads of mechanosignaling. Genes Dev. 2015;29:225–237. doi: 10.1101/gad.255968.114. - DOI - PMC - PubMed
    1. Gonzalo S, Kreienkamp R, Askjaer P. Hutchinson-Gilford progeria syndrome: a premature aging disease caused by LMNA gene mutations. Ageing Res. Rev. 2017;33:18–29. doi: 10.1016/j.arr.2016.06.007. - DOI - PMC - PubMed
    1. Ungricht R, Kutay U. Mechanisms and functions of nuclear envelope remodelling. Nat. Rev. Mol. Cell Biol. 2017;18:229–245. doi: 10.1038/nrm.2016.153. - DOI - PubMed
    1. Burke B, Stewart CL. The nuclear lamins: flexibility in function. Nat. Rev. Mol. Cell. Biol. 2013;14:13–24. doi: 10.1038/nrm3488. - DOI - PubMed
    1. Capell BC, Collins FS. Human laminopathies: nuclei gone genetically awry. Nat. Rev. Genet. 2006;7:940–952. doi: 10.1038/nrg1906. - DOI - PubMed

Publication types

MeSH terms