. 2018 Jul 15:108:189-200.
doi: 10.1016/j.exger.2018.04.020. Epub 2018 Apr 26.

Low doses of DNA damaging agents extend Saccharomyces cerevisiae chronological lifespan by promoting entry into quiescence

Affiliations

Low doses of DNA damaging agents extend Saccharomyces cerevisiae chronological lifespan by promoting entry into quiescence

Emily M Ross et al. Exp Gerontol. .

Abstract

A variety of mild stresses have been shown to extend lifespan in diverse species through hormesis, which is a beneficial response to a stress or toxin that would cause a negative response at a higher exposure. Whether particular stresses induce hormesis can vary with genotype for a given species, and the underlying mechanisms of lifespan extension are only partly understood in most cases. We show that low doses of the DNA damaging or replication stress agents hydroxyurea, methyl methanesulfonate, 4-nitroquinoline 1-oxide, or Zeocin (a phleomycin derivative) lengthened chronological lifespan in Saccharomyces cerevisiae if cells were exposed during growth, but not if they were exposed during stationary phase. Treatment with these agents did not change mitochondrial activity, increase resistance to acetic acid, ethanol, or heat stress, and three of four treatments did not increase resistance to hydrogen peroxide. Stationary phase yeast populations consist of both quiescent and nonquiescent cells, and all four treatments increased the proportion of quiescent cells. Several mutant strains with deletions in genes that influence quiescence prevented Zeocin treatment from extending lifespan and from increasing the proportion of quiescent stationary phase cells. These data indicate that mild DNA damage stress can extend lifespan by promoting quiescence in the absence of mitohormesis or improved general stress responses that have been frequently associated with improved longevity in other cases of hormesis. Further study of the underlying mechanism may yield new insights into quiescence regulation that will be relevant to healthy aging.

Keywords: Aging; Chronological lifespan; DNA damage; Hormesis; Quiescence; Saccharomyces cerevisiae.


Conflict of interest statement

Conflict of interest

The authors declare no conflict of interest.

Figures

Fig. 1
Fig. 1
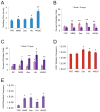
Exposure to low doses of DNA damaging agents during growth in rich medium extends yeast CLS. (A) A representative chronological aging experiment for cells grown in control YPD medium or YPD with the indicated chemical agents, using trypan blue dye exclusion to determine viability. Mean and standard deviation for median (days to 50% viability) or maximum CLS (days to 10% viability) for three trials with treatment beginning on day zero in YPD medium (B), on day three in YPD medium (C), on day zero in SC medium (D), and on day zero in SC medium with PBS (E). Asterisks indicate significant differences: * = p < 0.05, ** = p < 0.01, *** = p < 0.001.
Fig. 2
Fig. 2
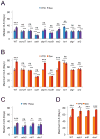
Exposure to DNA damaging agents slows growth, increases the proportion of budded cells, and increases mutation frequencies. (A) Doubling time in hours during exponential phase for cells grown in control YPD medium or YPD with the indicated chemical agents determined by counting cells by microscopy. (B) Percentage of cells in early stationary phase (day three) with small or large buds in YPD medium without or with the indicated chemical agents added at day zero. (C) Percentage of cells at day three with small or large buds in SC medium without or with the indicated chemical agents added at day zero. Frequency of canavanine-resistant (D) or FOA-resistant (E) cells at early stationary phase for cells grown in YPD medium without or with chronic exposure to the indicated chemical agents. Mean and standard deviation are shown for three trials in each case. Asterisks indicate significant differences: * = p < 0.05 and ** = p < 0.01.
Fig. 3
Fig. 3
Increased stress resistance does not account for lifespan extension induced by DNA damaging agents. Colony-forming units (cfu) per ml relative to mock treatment for cells grown in YPD without or with the indicated chemical treatments for 20–24 h and exposed to 50 °C for 7 min or 3 mM hydrogen peroxide for 1 h (A) or 15% ethanol for 20 min or 100 mM acetic acid for 1.5 h (B). (C) Viability determined by trypan blue dye exclusion for cells grown for 24 h in YPD without or with the indicated chemical agents and then exposed to 20% ethanol for 1 h or 52 °C for 45 min. Mean and standard deviation are shown for three (A and B) or five trials (C). Asterisks indicate significant differences compared to YPD with no chemical treatment: * = p < 0.05 and ** = p < 0.01.
Fig. 4
Fig. 4
Mitohormesis does not account for lifespan extension induced by DNA damaging agents. Fluorescence signal normalized to unstained controls to measure superoxide levels by DHE fluorescence (A), peroxide levels by DHR fluorescence (B), or mitochondrial membrane potential by DiOC6 fluorescence (C) for five to six trials of cells grown in YPD medium without or with chronic exposure to the DNA damaging agents and sampled on day one or three. In all cases, mean and standard deviation values are shown, and asterisks indicate significant differences: * = p < 0.05, ** = p < 0.01.
Fig. 5
Fig. 5
Exposure to DNA damaging agents promotes entry into quiescence. (A) Percentage of quiescent cells obtained by Percoll density gradient fractionation of cells on day four following growth in YPD without or with the indicated DNA damaging agents. Data for four to five trials are shown for each treatment. (B) Plating efficiency of fractionated Q and NQ cells from experiments shown in A. (C) Percentage of Q cells obtained by Percoll density gradient fractionation of cells on day four after growth in SC without or with chronic exposure to the indicated DNA damaging agents. Data for three trials are shown. (D) Percentage of Q cells obtained after treating cells in YPD medium with Zeocin on day three and fractionating cells on day four. Data for five trials are shown. (E) Percentage of Q cells obtained after growing cells in YPD, YP + 2% ethanol (YPE), YP + 0.2% glucose (YPlowG), SC, or SC + PBS for four days, or seven days (7d) for YPlowG. Data for three trials are shown. Mean and standard deviation are shown in all cases, and asterisks indicate significant differences: * = p < 0.05, ** = p < 0.01, *** = p < 0.001.
Fig. 6
Fig. 6
Deletion of genes that contribute to Q cell formation and function prevent Zeocin treatment from increasing the proportion of Q cells. Each panel shows the percentage of Q cells obtained by Percoll density gradient fractionation of wild type (WT) or mutant strains on day four after growth in YPD without or with chronic Zeocin treatment for a different set of mutant strains. Mean and standard deviation for three to seven trials per strain are shown. Horizontal lines indicate comparisons between untreated and treated cells for each strain, and asterisks over individual columns indicate differences compared to WT. Asterisks indicate significant differences, as in Fig. 5, and “ns” indicates not significant.
Fig. 7
Fig. 7
Many mutants that prevent Zeocin from increasing the proportion of Q cells also prevent lifespan extension. Median (days to 50% viability, panels A and C) or maximum CLS (days to 10% viability, panels B and D) for wild type (WT) or the indicated mutant strains grown in YPD without or with chronic exposure to Zeocin beginning on day zero. Mutants in panels A and B prevented Zeocin from increasing the proportion of Q cells, and mutants in panels C and D did not. Mean and standard deviation for three trials are shown. Horizontal lines, asterisks, and “ns” are used to indicate the presence or absence of significant differences as for Fig. 6.

References

    1. Ackerman SH, Tzagoloff A. ATP10, a yeast nuclear gene required for the assembly of the mitochondrial F1-F0 complex. J Biol Chem. 1990;265:9952–9959. - PubMed
    1. Allen C, Büttner S, Aragon AD, Thomas JA, Meirelles O, Jaetao JE, Benn D, Ruby SW, Veenhuis M, Madeo F, Werner-Washburne M. Isolation of quiescent and nonquiescent cells from yeast stationary-phase cultures. J Cell Biol. 2006;174:89–100. - PMC - PubMed
    1. Alvers AL, Fishwick LK, Wood MS, Hu D, Chung HS, Dunn WA, Aris JP. Autophagy and amino acid homeostasis are required for chronological longevity in Saccharomyces cerevisiae. Aging Cell. 2009;8:353–369. - PMC - PubMed
    1. Amberg DC, Burke DJ, Strathern JN. Methods in Yeast Genetics: A Cold Spring Harbor Laboratory Course Manual. 2005. Cold Spring Harbor Laboratory Press; Cold Spring Harbor, New York: 2005.
    1. Anderson EN, Corkins ME, Li JC, Singh K, Parsons S, Tucey TM, Sorkaç A, Huang H, Dimitriadi M, Sinclair DA, Hart AC. C. elegans lifespan extension by osmotic stress requires FUdR, base excision repair, FOXO, and sirtuins. Mech Ageing Dev. 2016;154:30–42. - PMC - PubMed

Publication types

MeSH terms