. 2018 May 3;102(5):776-793.
doi: 10.1016/j.ajhg.2018.03.001. Epub 2018 Apr 26.

An Osteoporosis Risk SNP at 1p36.12 Acts as an Allele-Specific Enhancer to Modulate LINC00339 Expression via Long-Range Loop Formation

Affiliations

An Osteoporosis Risk SNP at 1p36.12 Acts as an Allele-Specific Enhancer to Modulate LINC00339 Expression via Long-Range Loop Formation

Xiao-Feng Chen et al. Am J Hum Genet. .

Abstract

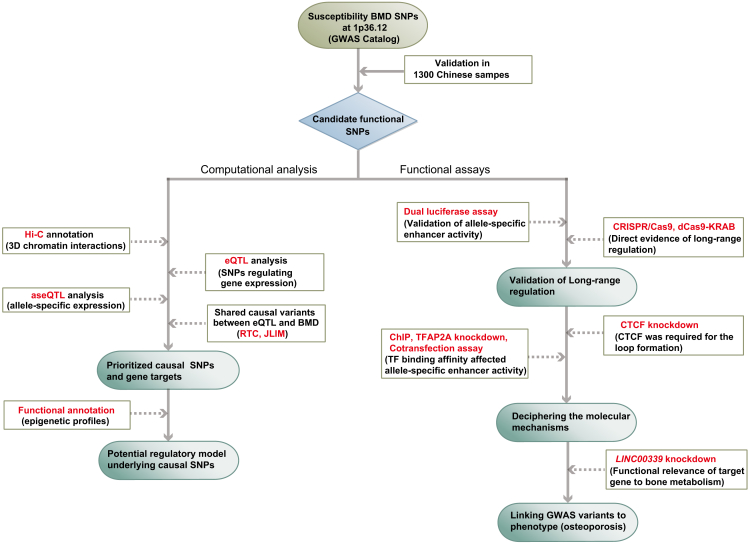
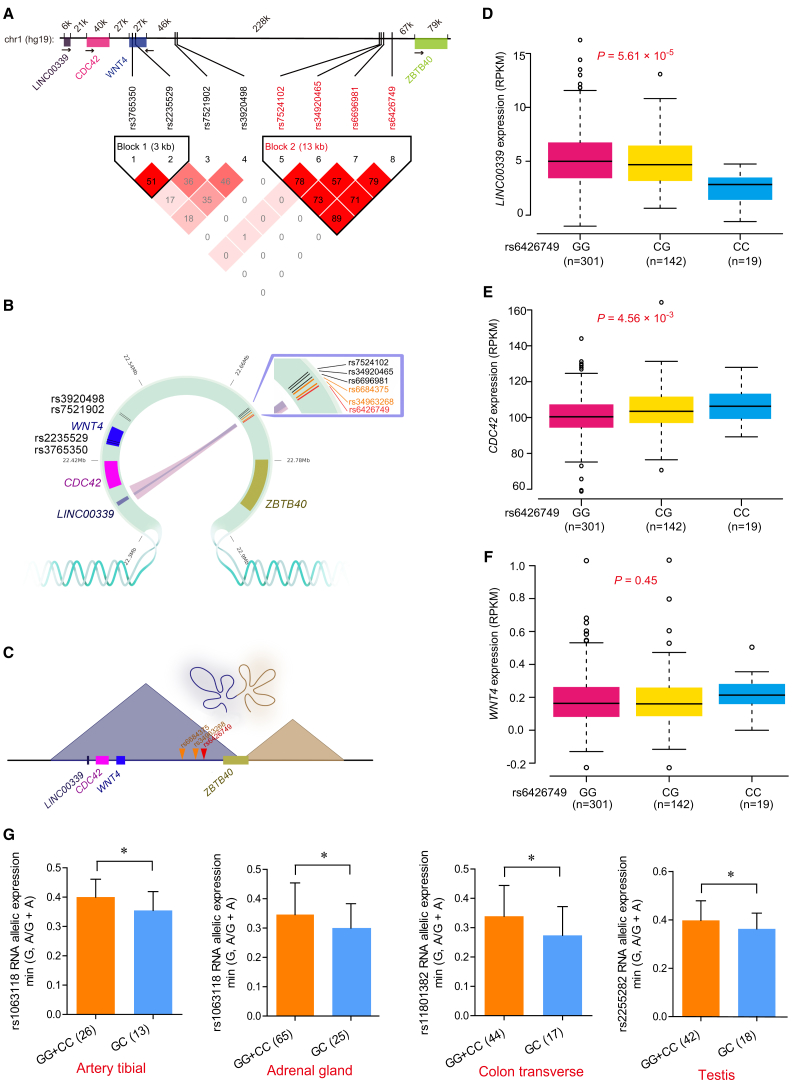
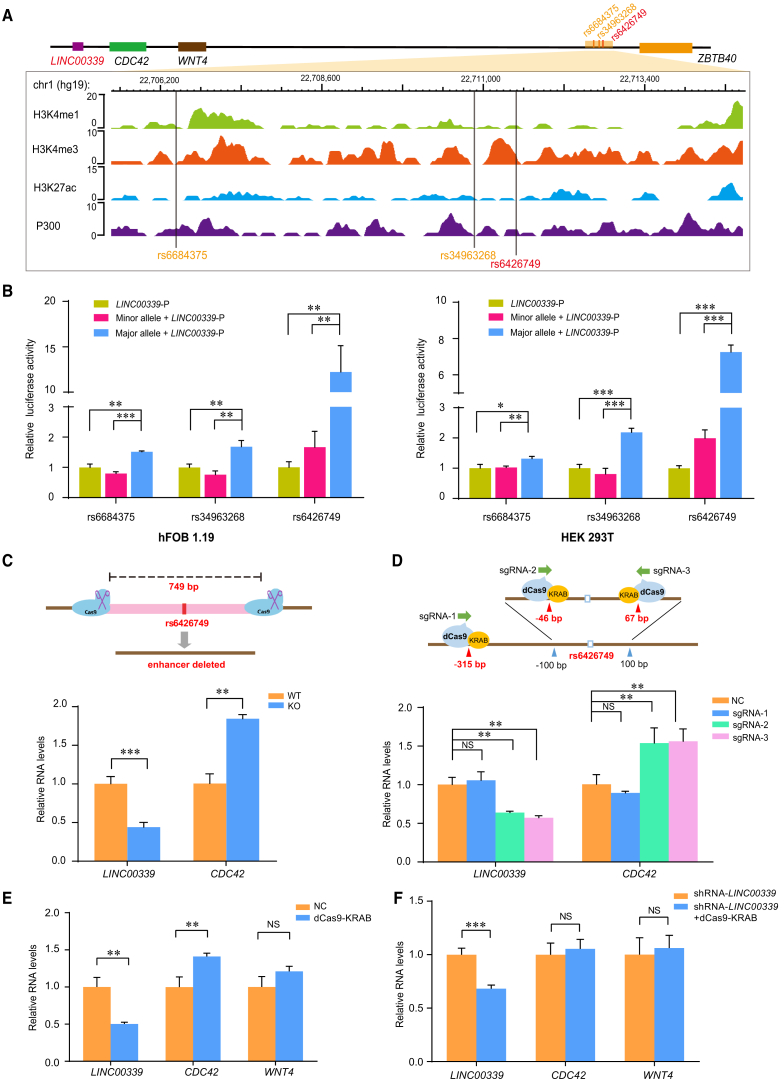
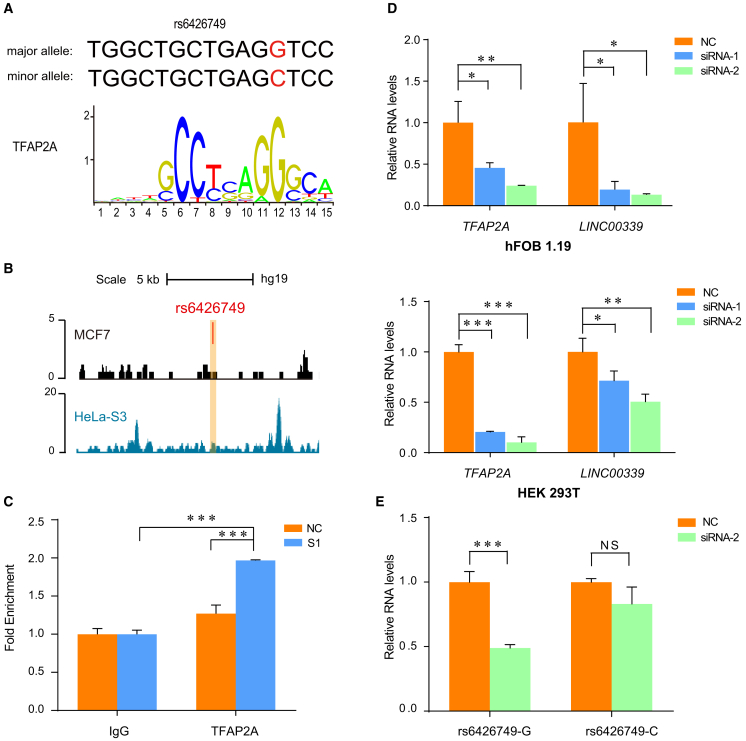
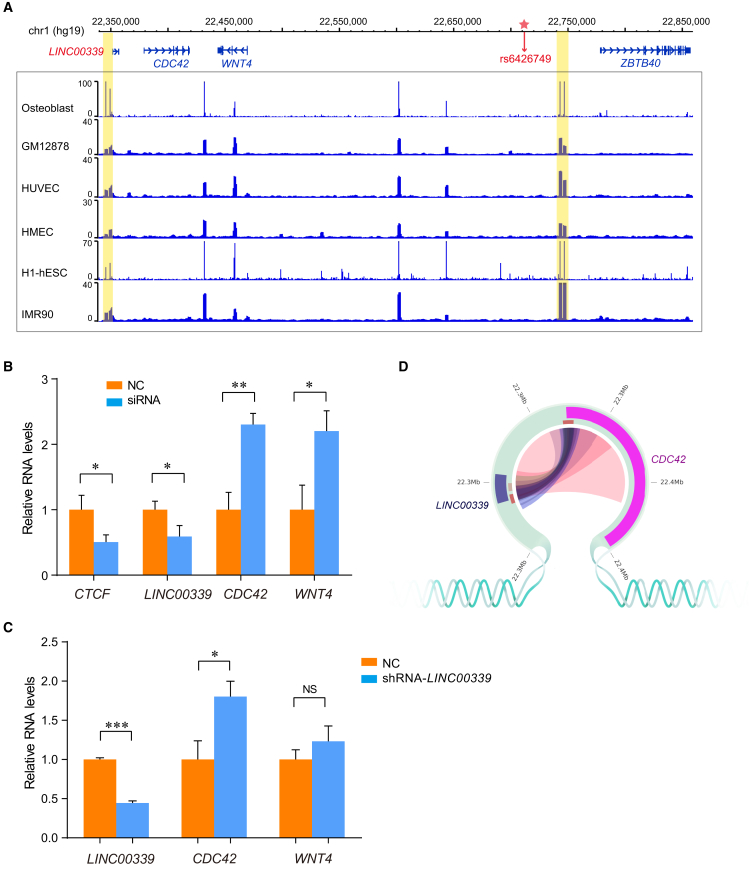
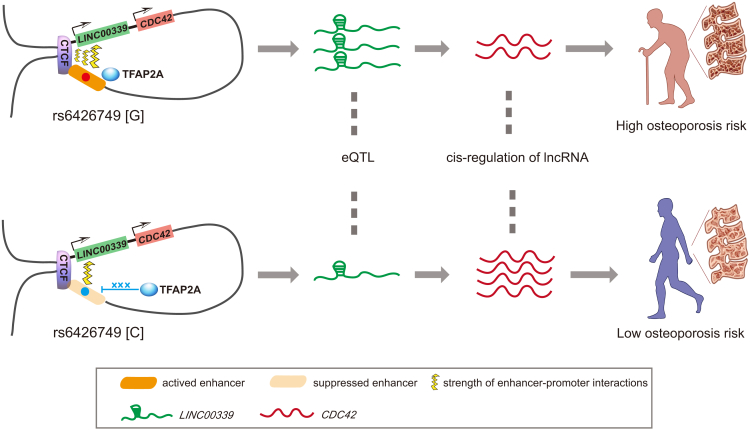
Genome-wide association studies (GWASs) have reproducibly associated variants within intergenic regions of 1p36.12 locus with osteoporosis, but the functional roles underlying these noncoding variants are unknown. Through an integrative functional genomic and epigenomic analyses, we prioritized rs6426749 as a potential causal SNP for osteoporosis at 1p36.12. Dual-luciferase assay and CRISPR/Cas9 experiments demonstrate that rs6426749 acts as a distal allele-specific enhancer regulating expression of a lncRNA (LINC00339) (∼360 kb) via long-range chromatin loop formation and that this loop is mediated by CTCF occupied near rs6426749 and LINC00339 promoter region. Specifically, rs6426749-G allele can bind transcription factor TFAP2A, which efficiently elevates the enhancer activity and increases LINC00339 expression. Downregulation of LINC00339 significantly increases the expression of CDC42 in osteoblast cells, which is a pivotal regulator involved in bone metabolism. Our study provides mechanistic insight into how a noncoding SNP affects osteoporosis by long-range interaction, a finding that could indicate promising therapeutic targets for osteoporosis.

Keywords: 1p36.12; LINC00339; TFAP2A; chromatin interaction; eQTL; enhancer; long-range; loop; osteoporosis; rs6426749.


Figures

Figure 1
Figure 1
Flowchart for the Integrative Analyses Approach Flowchart for the identification of functional BMD SNPs at 1p36.12 followed by experimental validation.
Figure 2
Figure 2
Integrating Analyses Indicate the Long-Range Interaction between rs6426749 and LINC00339 (A) LD blocks for eight BMD SNPs. The upper bar shows genomic positions for eight BMD SNPs in 1p36.12 and nearby genes, with distance between genes and (or) SNPs displayed above (kb). The bottom inverted triangle shows the LD blocks for eight BMD SNPs at 1p36.12, with each diamond representing the r2 measure of LD using standard color scheme, where the darker shades of red represent greater values. (B) Hi-C interactions between eQTLs and promoters of target genes, and different color of lines indicated different Hi-C dataset (pink: Hi-C data on IMR90 cells from 4DGenome; blue: DNase Hi-C data on H1-hESC cells30). SNP rs6426749 overlapped with Hi-C regions is labeled in red. Another two SNPs in strong LD with rs6426749 within the same Hi-C interaction regions are labeled in orange. (C) The loop between rs6426749 and LINC00339 is located within a 600 kb topologically associated domain (TAD) in IMR90 cells. (D–F) Boxplot for LINC00339 (D) or CDC42 (E) or WNT4 (F) expression in samples with different genotypes of rs6426749 (GG, CG, CC) taken from 462 LCLs samples. Sample counts are shown. (G) Allele-specific expression (ASE) analysis between rs6426749 and LINC00339, using monoallelic gene expression data from GTEx. Four significant tissues (p < 0.05) are shown. The horizontal axis represents individuals with homozygous or homozygous genotypes for rs6426749. The vertical axis represents the exonic SNP chosen as a measurement of allelic expression of LINC00339. Error bars, SD; p < 0.05 as determined by Wilcoxon rank sum test.
Figure 3
Figure 3
The Region Containing rs6426749 Acts as Strong Allele-Specific Enhancer on the LINC00339 Promoter (A) Epigenetic annotation for region surrounding rs6684375, rs34963268, and rs6426749 in osteoblast cells. The data are obtained from ENCODE Project taken from WashU EpiGenome Browser, including active histone modification (H3k4me1, H3K4me3, H3k27ac) as well as acetyltransferase (P300). (B) The dual-luciferase assay for LINC00339 promoter (LINC00339-P) containing rs6684375, rs34963268, or rs6426749 locus with either the major or minor allele, or individual LINC00339-P was measured in hFOB 1.19 cells or HEK293T cells. The individual LINC00339-P was used as baseline control. Luciferase signal was normalized to Renilla signal. Error bars, SD. n ≥ 3. ∗∗p < 0.01, ∗∗∗p < 0.001 as determined by an unpaired, two-tailed Student’s t test. (C) Comparison of LINC00339 and CDC42 expression between rs6426749 region deleted hFOB 1.19 cells (KO) mediated by CRISPR/Cas9 and normal cells (WT). (D) Comparison of LINC00339 and CDC42 expression between rs6426749-locus repressed hFOB 1.19 cells using dCas9-KRAB and normal cells (NC, negative control). One distal sgRNA (sgRNA-1) and two proximal sgRNAs (sgRNA-2, sgRNA-3) were designed. (E) Effect of rs6426749-locus repression in hFOB 1.19 cells using dCas9-KRAB (sgRNA-3) on LINC00339, CDC42, and WNT4 expression. (F) RT-qPCR for LINC00339, CDC42, and WNT4 expressions in hFOB 1.19 cells after silencing of both LINC00339 using shRNA and rs6426749-locus using dCas9-KRAB (blue) as compared with LINC00339 silenced cells (orange), respectively. Error bars, SD. n ≥ 3. NS: not significant, ∗∗p < 0.01, ∗∗∗p < 0.001 as determined by an unpaired, two-tailed Student’s t test.
Figure 4
Figure 4
Identification of Transcription Factors Required for the Activity of Enhancer Containing rs6426749 (A) Motif analysis indicated that TFAP2A motif exclusively binds to G allele of rs6426749. (B) TFAP2A binding surrounding rs6426749 was observed in MCF7 cells (GEO: GSE44257) and HeLa-S3 cells (ENCODE Project, taken from UCSC Genome browser). (C) ChIP-qPCR of TFAP2A binding at rs6426749 region and negative control region in HEK293T cells. Primers targeting rs6426749 region (S1) or RPL30 exon (NC) are used. The binding of TFAP2A is shown as fold enrichment over IgG. (D) The siRNA-mediated depletion of TFAP2A diminished LINC00339 expression. RT-qPCR for TFAP2A and LINC00339 expression in hFOB 1.19 cells or HEK293T cells after knockdown of TFAP2A (siRNA-1 and siRNA-2: two different siRNAs, blue and green) compared to NC siRNA-treated cells (NC: negative control, orange), respectively. (E) The siRNA-mediated depletion of TFAP2A specifically diminished activity of enhancer containing rs6426749 on LINC003339 expression. The pGL3 basic vector containing rs6426749-G (C) allele locus and LINC00339 promoter (see also Figure 2B), as well as the TFAP2A silencer (siRNA-2) or negative control was cotransfected into the hFOB 1.19 cells. Error bars, SD. n ≥ 3. NS: not significant, p < 0.05, ∗∗p < 0.01, ∗∗∗p < 0.001 as determined by an unpaired, two-tailed Student’s t test.
Figure 5
Figure 5
CTCF Modulated Long-Range Loop Formation between cis-eQTLs and LINC00339 and LINC00339 Negatively Regulated CDC42 (A) CTCF binding sites surrounding rs6426749 or LINC00339 from six different healthy cells taken from WashU EpiGenome Browser are displayed, with focal peak regions highlighted by yellow colors. (B) The siRNA-mediated depletion of CTCF diminished LINC00339 expression while it elevated both CDC42 and WNT4 expression. RT-qPCR for CTCF, LINC00339, and CDC42 expression in hFOB 1.19 cells after knockdown of CTCF (siRNA, blue) compared to NC siRNA-treated cells (NC: negative control, orange). (C) RT-qPCR for LINC00339, CDC42, and WNT4 expressions in hFOB 1.19 cells after silencing of LINC00339 using shRNA (blue) compared to NC-treated cells. (D) Hi-C annotation revealed interaction between LINC00339 and CDC42. Different shade of colors represents the strength of long-range interactions, and different colors indicated different Hi-C dataset (pink: Hi-C data on IMR90 cells from 4DGenome; blue: DNase Hi-C data on H1-hESC cells; purple: ChIA-PET data taken from ENCODE on three cell lines [HeLa-S3, K562, and MCF-7] or CEO database on GM12878 cells32). Error bars, SD. n ≥ 3. NS: not significant, p < 0.05, ∗∗p < 0.01, ∗∗∗p < 0.001 as determined by an unpaired, two-tailed Student’s t test.
Figure 6
Figure 6
Potential Regulatory Model between rs6426749, LINC00339, and CDC42 A schematic representation elucidating how genetic variant (rs6426749) affects disease predisposition (osteoporosis). In the top panel, rs6426749-G allele robustly binds to TFAP2A, which elevates the activity of enhancer containing rs6426749 and increases LINC00339 expression. Overexpressed LINC00339 acts as a cis-regulatory element to suppress CDC42 expression, whose relative low expression level is a risk factor to decrease BMD and increase osteoporosis incidence. In the bottom panel, in contrast, rs6426749-C allele is absent from TFAP2A binding, which represses the enhancer activity, resulting in relatively lower LINC00339 expression, which further increases the CDC42 expression. The relatively high expression level of CDC42 decreases the risk to osteoporosis incidence.

References

    1. Frazer K.A., Murray S.S., Schork N.J., Topol E.J. Human genetic variation and its contribution to complex traits. Nat. Rev. Genet. 2009;10:241–251. - PubMed
    1. Liu N.Q., Ter Huurne M., Nguyen L.N., Peng T., Wang S.Y., Studd J.B., Joshi O., Ongen H., Bramsen J.B., Yan J. The non-coding variant rs1800734 enhances DCLK3 expression through long-range interaction and promotes colorectal cancer progression. Nat. Commun. 2017;8:14418. - PMC - PubMed
    1. Gupta R.M., Hadaya J., Trehan A., Zekavat S.M., Roselli C., Klarin D., Emdin C.A., Hilvering C.R.E., Bianchi V., Mueller C. A genetic variant associated with five vascular diseases is a distal regulator of endothelin-1 gene expression. Cell. 2017;170:522–533.e15. - PMC - PubMed
    1. Kanis J.A., Delmas P., Burckhardt P., Cooper C., Torgerson D., The European Foundation for Osteoporosis and Bone Disease Guidelines for diagnosis and management of osteoporosis. Osteoporos. Int. 1997;7:390–406. - PubMed
    1. Johnell O., Kanis J.A., Oden A., Johansson H., De Laet C., Delmas P., Eisman J.A., Fujiwara S., Kroger H., Mellstrom D. Predictive value of BMD for hip and other fractures. J. Bone Miner. Res. 2005;20:1185–1194. - PubMed

Publication types

MeSH terms