. 2018 May 14;33(5):862-873.e5.
doi: 10.1016/j.ccell.2018.03.027. Epub 2018 Apr 26.

Extrinsic Phagocyte-Dependent STING Signaling Dictates the Immunogenicity of Dying Cells

Affiliations

Extrinsic Phagocyte-Dependent STING Signaling Dictates the Immunogenicity of Dying Cells

Jeonghyun Ahn et al. Cancer Cell. .

Abstract

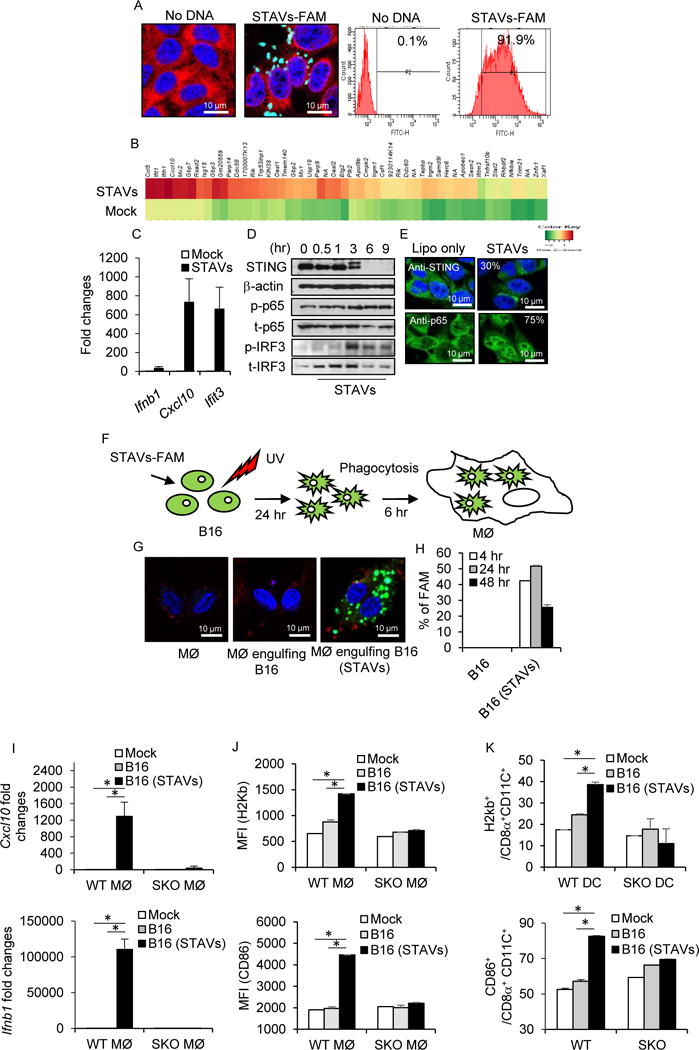
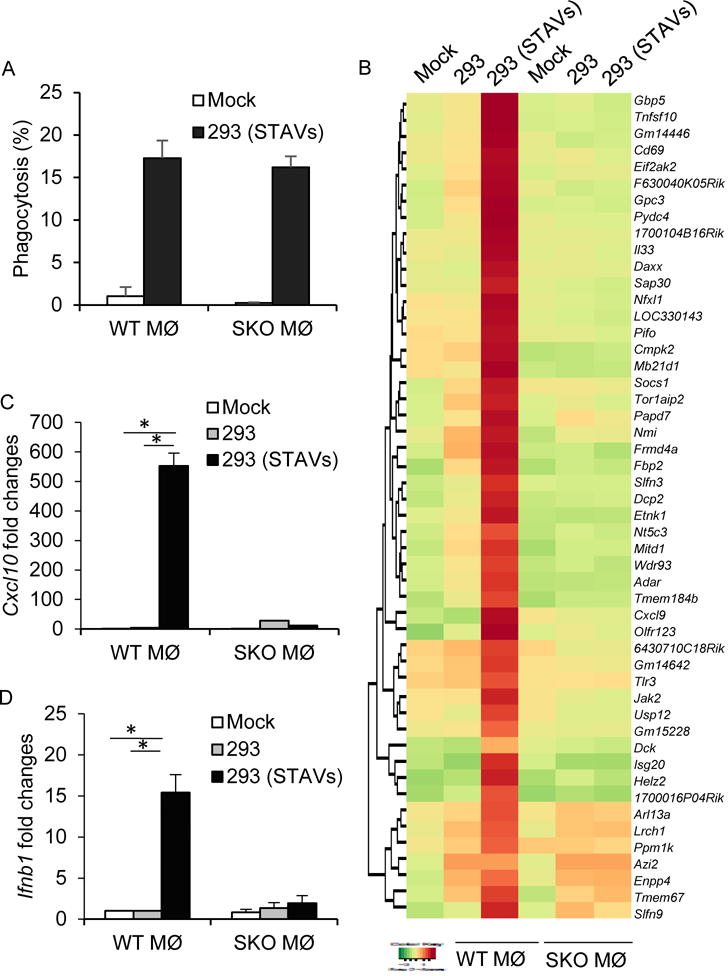
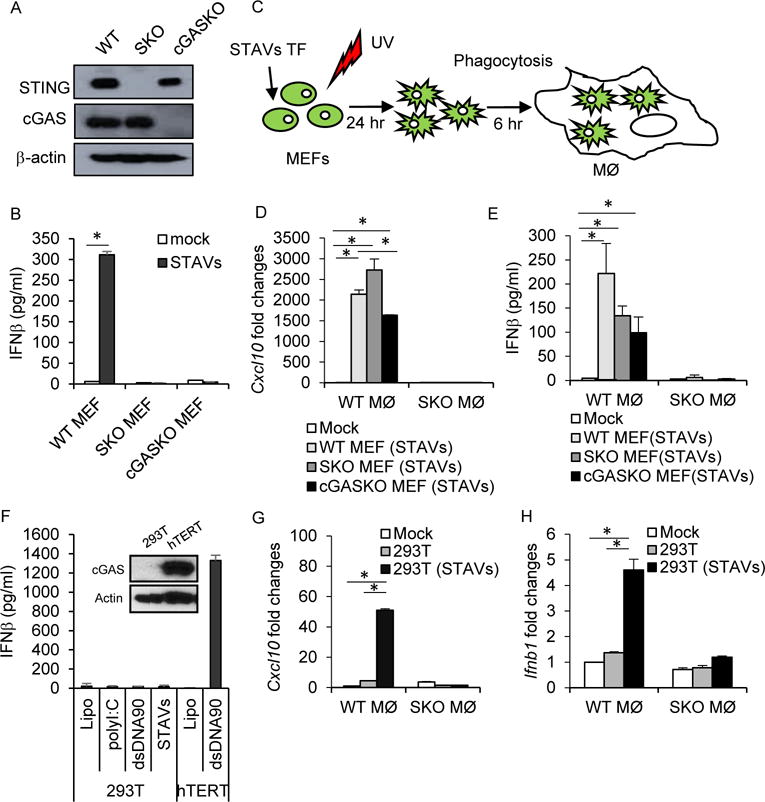
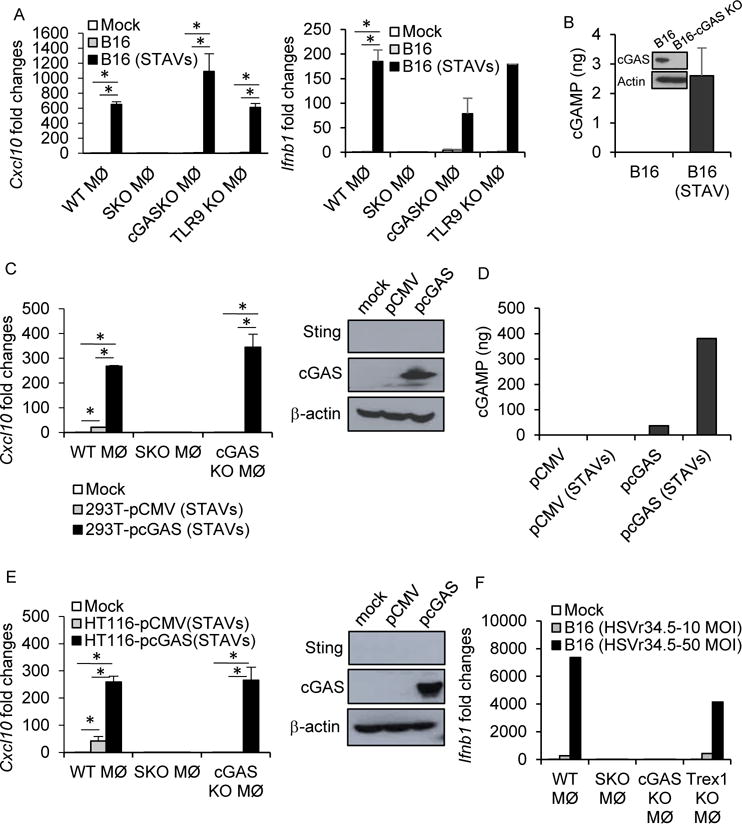
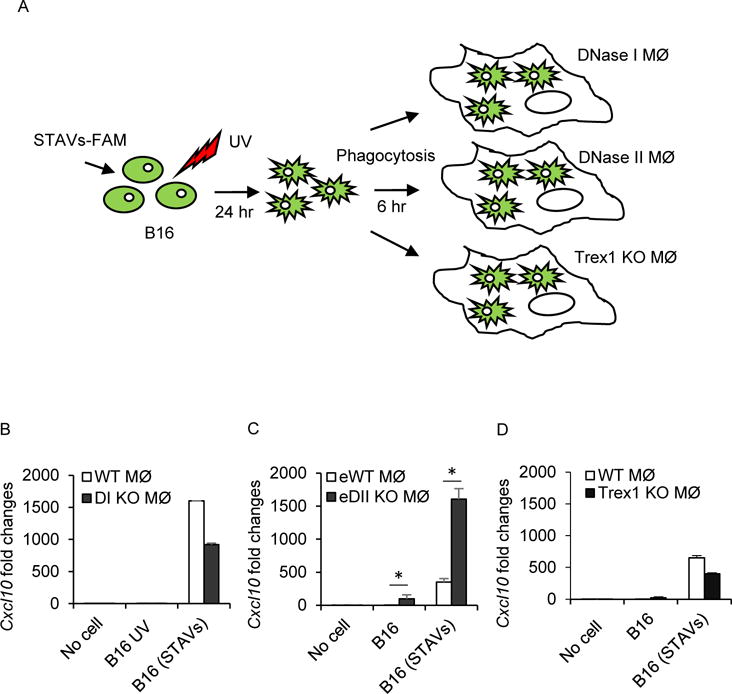
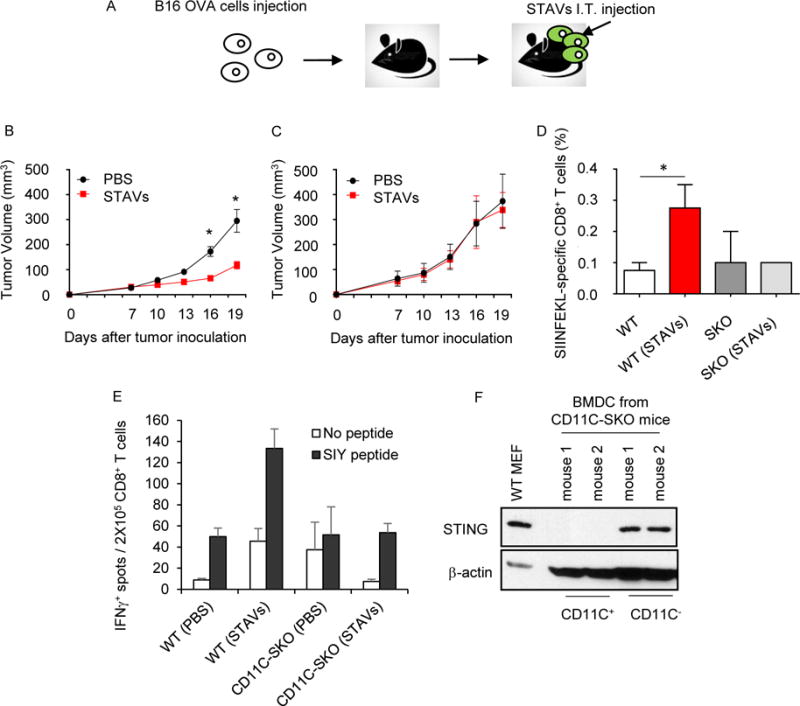
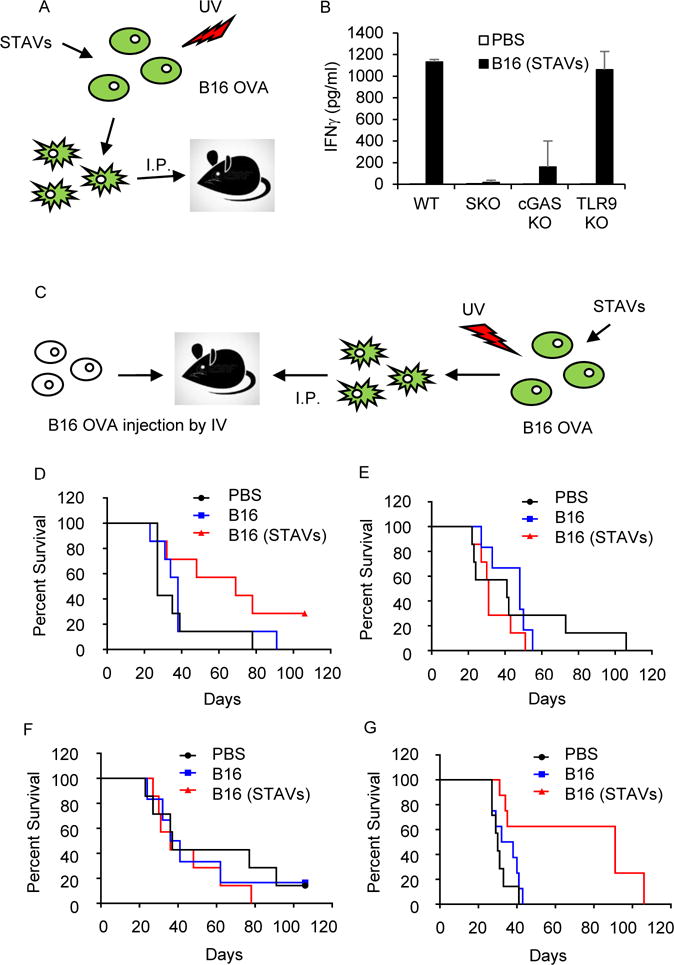
The ability of dying cells to activate antigen-presenting cells (APCs) is carefully controlled to avoid unwarranted inflammatory responses. Here, we show that engulfed cells containing cytosolic double-stranded DNA species (viral or synthetic) or cyclic di-nucleotides (CDNs) are able to stimulate APCs via extrinsic STING (stimulator of interferon genes) signaling, to promote antigen cross-presentation. In the absence of STING agonists, dying cells were ineffectual in the stimulation of APCs in trans. Cytosolic STING activators, including CDNs, constitute cellular danger-associated molecular patterns (DAMPs) only generated by viral infection or following DNA damage events that rendered tumor cells highly immunogenic. Our data shed insight into the molecular mechanisms that drive appropriate anti-tumor adaptive immune responses, while averting harmful autoinflammatory disease, and provide a therapeutic strategy for cancer treatment.

Keywords: STING; STING-dependent adjuvants (STAVs); anti-tumor T cells; antigen-presenting cells (APCs); cyclic di-nucleotides (CDNs); innate immunity; interferon.


Conflict of interest statement

DECLARATION OF INTERESTS

The authors declare no competing interests.

The authors have a patent related to this work. Application number: 15/120,694/Undergoing Examination.

Figures

Figure 1
Figure 1. Activation of macrophages by exogenous cytosolic DNA (STAVs) in engulfed apoptotic cells
(A) Confocal analysis and flow cytometry analysis of B16 OVA cells (B16) transfected with FAM labeled STAVs (green). DAPI (blue) and anti-calreticulin (red) as counter staining; bar size, 10 μm. (B) Gene array analysis of B16 cells transfected with 3 μg/ml of STAVs for 6 hr. Highest variable inflammation-related genes are shown. (C) qRT-PCR analysis of Ifnb1, Cxcl10 and Ifit3 in B16 OVA cells same as in (B). (D) Western blot analysis of STING, p65 and IRF3 in B16 cells transfected with 3 μg/ml of STAVs and incubated for time courses as indicated. (E) Immunofluorescent Microscopy analysis using anti-STING and anti-p65 in B16 cells at 3 hr after transfection of STAVs (3 μg/ml); bar size, 10 μm. (F) Schematic representation of the phagocytosis of B16 cells by macrophages. B16 cells were transfected by 3 μg/ml of STAVs for 3 hr and irradiated by UV (120 mJ/cm). The irradiated B16 cells were feed to macrophages (MØ) at 24 hr after UV irradiation. (G, H) Confocal Microscopy analysis (G) and flow cytometry analysis (H) in macrophages following cellular engulfment of B16 cells transfected with FAM labeled STAVs. (I) qRT-PCR analysis of Cxcl10 and Ifnb1 in wild type (WT) and STING knock out (SKO) macrophages (WT MØ and SKO MØ) following engulfment of B16 cells in presence or absence of STAVs. (J) Flow cytometry for H2Kb and CD86 on macrophages following phagocytosis of B16 cells. (K) Flow cytometry for CD86 and H2Kb on CD8α+CD11C+ dendritic cells following phagocytosis of B16 cells containing STAVs. Data is representative of at least three independent experiments. Error bars indicate mean ± SD. *, p<0.05; Student’s t-test. See also Figures S1, S2, S3 and Table S1.
Figure 2
Figure 2. Extrinsic STING signaling dependent gene expression in macrophages
(A) Flow cytometry analysis in macrophages following cellular engulfment of UV-irradiated HEK293 cells (293) transfected with FAM labeled STAVs. (B) Gene array analysis of WT and SKO macrophages following engulfment of irradiated 293 cells with/without STAVs. Highest variable inflammation-related genes are shown. (C, D) qRT-PCR analysis of Cxcl10 (C) and Ifnb1 (D) in same as in (A). Data is representative of at least three independent experiments. Error bars indicate mean ± SD. *, p<0.05; Student’s t-test. See also Table S2.
Figure 3
Figure 3. Macrophage stimulation in trans by cytosolic DNA
(A) Western blot analysis of STING and cGAS in mouse embryonic fibroblasts (MEFs). (B) ELISA analysis of IFNβ in WT, SKO and cGAS knock out (cGAS KO) transfected with 3 μg/ml of STAVs. (C) Schematic representation of the phagocytosis of MEFs by macrophages. (D, E) qRT-PCR analysis of Cxcl10 (D) and Ifnb1 (E) in WT and SKO macrophages following engulfment of UV irradiated WT, SKO and cGAS KO MEFs with 3 μg/ml of STAVs. (F) ELISA analysis of IFNβ in 293T and hTERT cells transfected with STAVs. (G, H) qRT-PCR analysis of Cxcl10 (G) and Ifnb1 (H) in WT and SKO macrophages following engulfment of UV irradiated 293T cells with or without STAVs. Data is representative of at least three independent experiments. Error bars indicate mean ± SD. *, p<0.05; Student’s t-test. See also Figures S4.
Figure 4
Figure 4. Extrinsic activation of the cGAS/STING axis in macrophages
(A) qRT-PCR analysis of Cxcl10 and Ifnb1 in WT, SKO, cGAS KO and TLR9 KO macrophages following engulfment of UV-irradiated B16 cells in presence of 3 μg/ml of STAVs or absence. (B) cGAS expression by Western blot and cGAMP amount by a hybrid mass spectrometer in B16 cells. B16-cGAS knock out cells were used as negative control for WB. (C) qRT-PCR analysis of Cxcl10 in WT, SKO, and cGAS KO macrophages following engulfment of UV-irradiated 293T cells containing 3 μg/ml of STAVs. The 293T cells were reconstituted with pcGAS or pCMV as control vector. (D) Measurement of cGAMP levels by a hybrid mass spectrometer in 293T cells same as in (c). (E) qRT-PCR analysis of Cxcl10 in WT, SKO, and cGAS KO macrophages following engulfment of UV-irradiated HT116 cells containing STAVs. The HT116 cells were reconstituted with pcGAS or pCMV as control vector. (F) qRT-PCR analysis of Ifnb1 in WT, SKO, cGAS KO, and Trex1 KO macrophages following engulfment of B16 cells infected with HSVγ34.5. The HT116 cells were reconstituted with pcGAS or pCMV as control vector. Error bars indicate mean ± SD. *; p<0.05, Student’s t-test. See also Figure S4.
Figure 5
Figure 5. Apoptotic cells containing STAVs escape degradation by DNase II
(A) Schematic representation of the phagocytosis of B16 cells by DNase I, DNase II, or Trex1 knockout macrophages. B16 cells were transfected by STAVs for 3 hr and irradiated by UV (120 mJ/cm). The irradiated B16 cells were feed to three different genotypes of macrophages (MØ) at 24 hr after UV irradiation. (B-D) qRT-PCR analysis of Cxcl10 in DNase I KO (B), DNase II KO (C) and Trex1 KO (D) macrophages at 6 hr following engulfment of B16 cells containing STAVs. B16; UV irradiated, B16 (STAVs); Transfected with STAVs and UV irradiated, DI KO, DNase I KO; eWT, WT embryo; eDII KO, DNase II KO embryo. Error bars indicate mean ± SD. *, p<0.05; Student’s t-test.
Figure 6
Figure 6. Anti-tumor activity of STAVs in B16 OVA melanomas bearing mice
(A) Schematic representation of intratumoral injection of STAVs in B16 OVA melanoma bearing mice. The mice were subcutaneously injected with B16-OVA cells on the flank. 10 μg of STAVs was injected intratumorally (i.t.) every three days. (B, C) Tumor volumes from WT (n=7/group) (B) and SKO mice (n=7/group) (C) were measured on the indicated days. (D) Frequency of OVA specific CD8+ T cells in the spleen from WT (n=4/group) and SKO (n=4/group) mice injected with STAV or PBS as control. (E) IFNγ ELISPOT assay in CD8+ T cells from WT or CD11C-cre;Stingloxp (CD11C-SKO) mice. The mice were subcutaneously injected with B16-SIY cells on the flank. 10 μg of STAVs was injected intratumorally (i.t.) every three days. CD8+ T cell priming was evaluated by IFNγ ELISPOT. (F) STING expression in CD11C+ bone marrow derived dendritic cells (BMDC) from the CD11C-SKO mice. CD11C+ cells were selected by CD11C microbeads (CD11C+), lysed and analyzed for STING expression by western blot. The unlabeled cell fraction was used as a control (CD11C). Error bars indicate mean ± SD. *, p<0.05; Student’s t-test. See also Figure S6.
Figure 7
Figure 7. Protection of lung metastasis by B16 OVA requires STING
(A) Schematic representation of the dead cell immunization. B16 OVA cells were transfected by STAVs for 3 hr and irradiated by UV (120 mJ/cm). After 24 hr, WT, SKO, TLR9 KO, and cGAS KO mice were intraperitoneally (i.p.) injected with irradiated B16 cells with/without STAV, twice every week. (B) IFNγ measurement in splenocytes from WT, SKO, TLR9 KO, and cGAS KO mice at 7 days after the second immunization. Error bars indicate mean ± SD. (C) Schematic representation of post-vaccination for B16 OVA mediated lung metastasis. WT, TLR9KO, SKO, and cGAS KO mice were intravenously (i.v.) injected with B16 OVA cells (5×10⁴ cells/mouse). On day 1, 3, 7, and 14, the mice were I.P injected by UV irradiated B16 OVA cells (1×10⁶ cells/mouse) with STAVs. (D-G) Survival rates from WT (p=0.0429, n=7/group) (D), SKO (p=0.2616, n=7/group) (E), cGAS KO (p=0.4075, n=7/group) (F), and TLR9KO (p=0.0012 n=7/group) (G) mice were monitored. PBS: Control group treated with PBS, B16: post-vaccinated group with UV-irradiated B16 cells, B16 (STAVs): post-vaccinated group with UV-irradiated B16 cells with STAVs. p values are based on Log-rank test, with p<0.05 considered statistically significant. See also Figure S7.

References

    1. Ablasser A, Goldeck M, Cavlar T, Deimling T, Witte G, Rohl I, Hopfner KP, Ludwig J, Hornung V. cGAS produces a 2′-5′-linked cyclic dinucleotide second messenger that activates STING. Nature. 2013;498:380–384. - PMC - PubMed
    1. Ahn J, Barber GN. Self-DNA, STING-dependent signaling and the origins of autoinflammatory disease. Curr Opin Immunol. 2014;31:121–126. - PubMed
    1. Ahn J, Gutman D, Saijo S, Barber GN. STING manifests self DNA-dependent inflammatory disease. Proc Natl Acad Sci U S A. 2012;109:19386–19391. - PMC - PubMed
    1. Ahn J, Ruiz P, Barber GN. Intrinsic self-DNA triggers inflammatory disease dependent on STING. J Immunol. 2014a;193:4634–4642. - PMC - PubMed
    1. Ahn J, Xia T, Konno H, Konno K, Ruiz P, Barber GN. Inflammation-driven carcinogenesis is mediated through STING. Nat Commun. 2014b;5:5166. - PMC - PubMed

Publication types