. 2018 May 17;173(5):1098-1110.e18.
doi: 10.1016/j.cell.2018.03.070. Epub 2018 Apr 26.

The Egyptian Rousette Genome Reveals Unexpected Features of Bat Antiviral Immunity

Affiliations

The Egyptian Rousette Genome Reveals Unexpected Features of Bat Antiviral Immunity

Stephanie S Pavlovich et al. Cell. .

Abstract

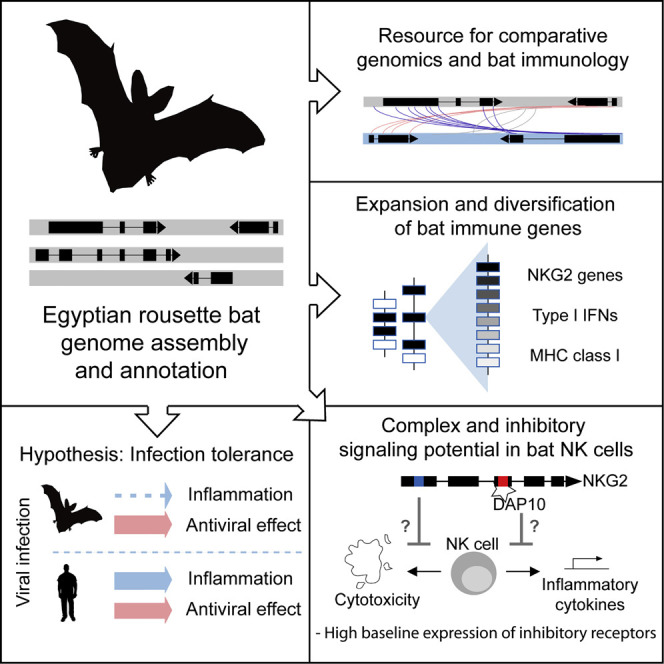
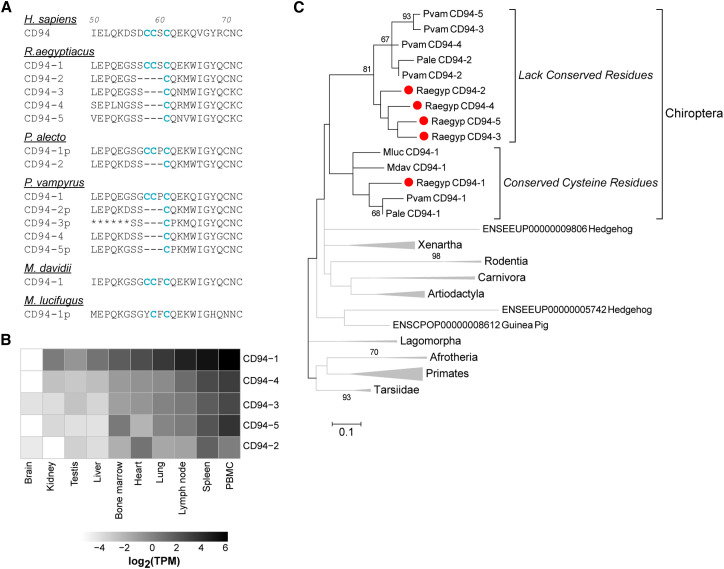
Bats harbor many viruses asymptomatically, including several notorious for causing extreme virulence in humans. To identify differences between antiviral mechanisms in humans and bats, we sequenced, assembled, and analyzed the genome of Rousettus aegyptiacus, a natural reservoir of Marburg virus and the only known reservoir for any filovirus. We found an expanded and diversified KLRC/KLRD family of natural killer cell receptors, MHC class I genes, and type I interferons, which dramatically differ from their functional counterparts in other mammals. Such concerted evolution of key components of bat immunity is strongly suggestive of novel modes of antiviral defense. An evaluation of the theoretical function of these genes suggests that an inhibitory immune state may exist in bats. Based on our findings, we hypothesize that tolerance of viral infection, rather than enhanced potency of antiviral defenses, may be a key mechanism by which bats asymptomatically host viruses that are pathogenic in humans.

Keywords: Chiroptera; antiviral immunity; filovirus; genome; innate immunity; natural killer cell receptors; type I interferon.


Conflict of interest statement

The authors declare no competing interests.

Figures

None
Graphical abstract
Figure S1
Figure S1
Genome Characteristics of Raegyp2.0, Related to Table 1 (A) K-mer frequency distribution in Raegyp2.0. The percentage (frequency, y axis) of all 25-mers that are present a given number of times (depth, x axis) in the Rousettus aegyptiacus genome sequence. (B) Heterozygosity of Raegyp2.0. SNPs: Single-nucleotide polymorphisms; indels: insertions or deletions. Scaffold and contig. (C and D) (C) Nx and (D) NGx plots in megabases (Mbp) for Raegyp2.0 with an estimated reference genome size of 2.11 Gb. See STAR Methods for detailed description of Nx and NGx plots.
Figure 1
Figure 1
Gene Family Expansion and Contraction across a Phylogenetic Tree of 15 Mammalian Species A maximum likelihood tree based on 2,400 orthologous proteins was generated and used to infer expansion and contraction of 7,698 gene families. The number of expanded and contracted gene families is in blue and red, respectively. Numbers in black are the bootstrap evidence for partitions based on 1,000 bootstrap replicates. Images used under a creative commons license. MRCA, most recent common ancestor. See also Tables S3 and S4, Data S1, and STAR Methods.
Figure S2
Figure S2
Model Selection Hierarchy for Positive and Purifying Selection Analysis, Related to Table 2 and STAR Methods RA = R. aegyptiacus, Mega = megabats other than R. aegyptiacus, Micro = microbats, Non-bat = all species in non-bat branches (human, crab-eating macaque, rhesus macaque, mouse, dog, cow, pig, guinea pig, hamster, and horse). Arrows indicate nested models (e.g., an arrow pointing from Model 1a to 2a means that Model 1a is nested in Model 2a). For each applicable model, color indicates which branches were used to estimate which evolution rate (orange - ω1; green - ω2; purple - ω3; gray - ω0, i.e., the background rate of evolution). Model 0 was the best-fitting for 330 genes, Model 1a for 5 genes, Model 1b for 65 genes, Model 1c for 23 genes, Model 2a for 0 genes, model 2b for 32 genes, and Model 3 for 1 gene.
Figure 2
Figure 2
Expansion of the NKG2 Genes in R. aegyptiacus (A) CD94 and NKG2 genes in the natural killer complex in Raegyp2.0. Each arrow designates a scaffold sequence in the Raegyp2.0 genome (see STAR Methods for accessions). Not pictured are pseudogenes and non-coding genes. The ellipse indicates the presence of additional non-NKG2 genes on the same scaffold. (B) Multiple sequence alignments showing activating and inhibitory signaling motifs in NKG2 genes in humans and three bats. There were no putative functional bat NKG2 genes identified in in P. alecto or M. davidii except NKG2-D. ITIM (immunoreceptor tyrosine-based inhibition motif) residues are in red, and the signal anchor residue lysine (K) or arginine (R) are in green and blue respectively. Dashes represent gaps in the alignment. (C) Expression of putative functional NKG2 genes in transcriptomic data from 10 tissues in a R. aegyptiacus bat. Rows are ordered by highest average expression of transcripts across all tissues for a given gene. Expression is reported in log2(TPM), where TPM refers to transcripts per million. Data analyzed from Lee et al. (2015). (D) Maximum likelihood phylogenetic tree of bat NKG2 proteins and homologs in other species. NKG2 proteins from R. aegyptiacus are colored by predicted function. Bootstrap evidence (percentage of 500 bootstrap replicates) is labeled on branches if 65 or over. See also Figures S3, S5, and S7 and STAR Methods.
Figure 3
Figure 3
Expression and Diversity of CD94 in R. aegyptiacus (A) Multiple sequence alignments showing conserved cysteine residues in CD94 genes in humans and five bats. Pseudogenes are indicated with the letter p in protein name. Asterisks indicate missing residues from a partial P. vampyrus CD94. (B) Expression of CD94 genes in transcriptomic data from ten tissues in an Egyptian rousette bat. Rows are ordered by highest average expression of transcripts across all tissues for a given gene. Expression is reported in log2(TPM), where TPM refers to transcripts per million. Data analyzed from Lee et al. (2015). (C) Maximum likelihood phylogenetic tree of bat CD94 proteins and homologs in other species. CD94 proteins from R. aegyptiacus are marked by red dots. Bootstrap evidence (percentage of 500 bootstrap replicates) is labeled on branches if over 65. See also Figure S3, Figure S4, Figure S5 and STAR Methods.
Figure S3
Figure S3
Multiple Sequence Alignments and Locus Maps of NKG2 Proteins in Bats, Related to Figures 2 and 3 Dots in alignments represent identity to the human protein sequence. (A and B) Alignment of human NKG2A and C and putative functional bat NKG2 protein sequences. (A) shows the NKG2 residues that are known to contact CD94 in the human NKG2A protein (in orange), and (B) shows the NKG2 residues that are known to contact HLA-E/peptide in human NKG2A protein (in blue) (Kaiser et al., 2008). (C) Locus maps of the NKG2 and CD94 genes in the natural killer complex. Each arrow designates a scaffold sequence in corresponding bat genome (see STAR Methods for accessions). Not pictured are unrelated pseudogenes and non-coding genes. The ellipse indicates the presence of additional non-NKG2 genes on the same scaffold. (D) Alignment of the transmembrane domain of putative functional NKG2D proteins in humans and bats. Dashes indicate positions of diversity in the consensus sequence. The conserved arginine residue that serves as a signal anchor is shown in red. NKG2D-1 is shown for M. davidii, and NKG2D-2 is shown for M. lucifugus.
Figure S4
Figure S4
Multiple Sequence Alignments of CD94 Proteins in Bats, Related to Figure 3 Dots in alignments represent identity to the human protein sequence, while dashes represent gaps in the alignment. (A and B) Alignment of human CD94 and putative functional bat CD94 protein sequences. (A) shows the CD94 residues that are known to contact NKG2A in the human CD94 protein (in orange), and (B) shows the CD94 residues that are known to contact HLA-E/peptide in human CD94 protein (in blue) (Kaiser et al., 2008). (C) Alignment of the transmembrane domain of CD94 in human, mouse, rat, and bats. The lysine (K) residue that serves as a signal anchor for DAP10 and DAP12 in rodents is shown in blue. This residue is not conserved in bat CD94 proteins. (D) Alignment of the cytoplasmic domain of CD94 in human and bats.
Figure S5
Figure S5
Related to Figures 2 and 3 (A–C) Expanded maximum likelihood phylogenies of (A) NKG2, (B) CD94 proteins, and (C) NKG2D proteins. R. aegyptiacus proteins are marked by red dots. Bootstrap evidence (percentage of 500 bootstrap replicates) is labeled on branches if over 65.
Figure 4
Figure 4
Characterization of the MHC Class I Region in Raegyp2.0 (A and B) Locus maps of (A) the MHC class I region and (B) MHC class I genes outside the canonical class I region in Raegyp2.0. Each arrow designates a scaffold sequence in the Raegyp2.0 genome (see STAR Methods for accessions). Not pictured are non-MHC pseudogenes and non-coding genes. The ellipse indicates the presence of additional genes on the same scaffold. Black, MHC class I genes; gray, non-MHC genes; dark blue, MICB; unfilled boxes, MHC class I pseudogenes. The α, κ, and β class I duplication blocks are shown in red, purple, and green, respectively. (C) Expression of MHC class I genes in transcriptomic data from 10 tissues in an Egyptian rousette bat. Rows are ordered by highest average expression of transcripts across all tissues for a given gene. Expression is reported in log2(TPM), where TPM refers to transcripts per million. Data analyzed from Lee et al. (2015). (D) Maximum likelihood phylogenetic tree of bat MHC class I proteins (R. aegyptiacus proteins in red) with human MHC class I proteins as an outgroup. Bootstrap evidence (percentage of 500 bootstrap replicates) is labeled on branches if 65 or over. (E) Sequence logo plots showing the sequence diversity of predicted nonamer peptides derived from the signal sequences of MHC class I genes from human (H. sapiens), mouse (M. musculus), R. aegyptiacus, and the gray mouse lemur (M. murinus). The y axis shows information content in bits, and the x axis shows position in the nonamer. See also STAR Methods.
Figure S6
Figure S6
NKG2D Ligands in Bats, Related to Figure 2 Maximum likelihood phylogenetic tree of bat and human NKG2D ligands or NKG2D ligand-like proteins. R. aegyptiacus sequences are shown in red. Bootstrap evidence (percentage of 500 bootstrap replicates) is labeled on branches if over 65. Green – MILL and MIC-like proteins, purple – RAET1E-like proteins, blue – human ULBP proteins, yellow – two groups of bat proteins. See STAR Methods for abbreviations.
Figure 5
Figure 5
Diversity of the Type I Interferons in Raegyp2.0 (A) Locus map of the type I IFNs in Raegyp2.0. Each arrow designates a scaffold sequence in the Raegyp2.0 genome (see STAR Methods for scaffold accessions). Unfilled boxes indicate pseudogenes. Orange, IFNβ; blue, IFNω; red, IFNα; yellow, IFNδ; purple, IFNε; green, IFNκ. The single non-IFN gene within the locus (KLHL9) is in gray. Not pictured are non-coding genes. The ellipse indicates the presence of additional non-IFN genes on the same scaffold. (B) Maximum likelihood phylogenetic tree of bat type I IFN proteins and homologs in other species. R. aegyptiacus proteins are marked in red, with groups of closely related proteins collapsed. Bootstrap evidence (percentage of 500 bootstrap replicates) is labeled on branches if 65 or over. See also Figure S6, Table S6, and STAR Methods.
Figure S7
Figure S7
Diversity and Expression of Type I IFN Genes in R. aegyptiacus, Related to Figure 5 (A) Phylogeny of R. aegyptiacus type I IFN proteins. Maximum likelihood phylogenetic tree of bat type I IFN proteins. Bootstrap evidence (percentage of 500 bootstrap replicates) is labeled on branches if over 65. (B) Antiviral effect of recombinant R. aegyptiacus IFN-ω4. RoNi cells were treated with recombinant IFN-ω4 (rIFN-ω4), rIFN-β1, or an unrelated protein (rPA-D1) for 4 hr, infected with VSV-eGFP at an MOI of 0.05, and imaged for eGFP expression 1 day post infection. Higher concentrations of recombinant IFN-ω4 inhibit viral replication as demonstrated by the absence of eGFP expression in cells after multiple viral replication cycles. Brightness was increased by 20% on all images. (C) Sendai virus (SeV) infection of RoNi cells elicits an IFN response, including IFN-ω. RoNi cell monolayers were infected with SeV strain Cantell at an MOI of 1.0 or mock infected, and harvested for total RNA extraction and sequencing at 3, 8, and 24 hr. Sequencing data were quantified by IFN subtype in transcripts per million (TPM). Values plotted are the mean ± standard deviation of three replicates for each time point. IFN-ε and IFN-δ were not expressed. Adj. p values from unpaired t test between SeV and mock:  < 0.05, ∗∗ < 0.005, ∗∗∗ < 0.0005. See STAR Methods.

Comment in

References

    1. Altschul S.F., Gish W., Miller W., Myers E.W., Lipman D.J. Basic local alignment search tool. J. Mol. Biol. 1990;215:403–410. - PubMed
    1. Amman B.R., Jones M.E.B., Sealy T.K., Uebelhoer L.S., Schuh A.J., Bird B.H., Coleman-McCray J.D., Martin B.E., Nichol S.T., Towner J.S. Oral shedding of Marburg virus in experimentally infected Egyptian fruit bats (Rousettus aegyptiacus) J. Wildl. Dis. 2015;51:113–124. - PMC - PubMed
    1. Averdam A., Petersen B., Rosner C., Neff J., Roos C., Eberle M., Aujard F., Münch C., Schempp W., Carrington M. A novel system of polymorphic and diverse NK cell receptors in primates. PLoS Genet. 2009;5:e1000688. - PMC - PubMed
    1. Bailly-Bechet M., Haudry A., Lerat E. “One code to find them all”: a perl tool to conveniently parse RepeatMasker output files. Mob. DNA. 2014;5:13.
    1. Baker M.L., Schountz T., Wang L.F. Antiviral immune responses of bats: a review. Zoonoses Public Health. 2013;60:104–116. - PMC - PubMed

Publication types

MeSH terms

Substances