. 2018 May 31;173(6):1535-1548.e16.
doi: 10.1016/j.cell.2018.03.074. Epub 2018 Apr 26.

Integrated Single-Cell Analysis Maps the Continuous Regulatory Landscape of Human Hematopoietic Differentiation

Affiliations

Integrated Single-Cell Analysis Maps the Continuous Regulatory Landscape of Human Hematopoietic Differentiation

Jason D Buenrostro et al. Cell. .

Abstract

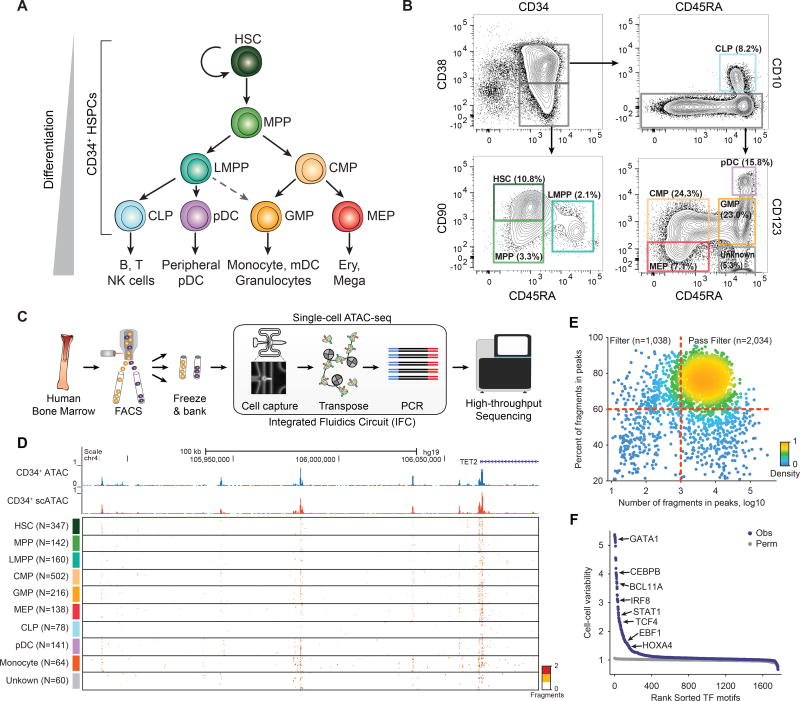
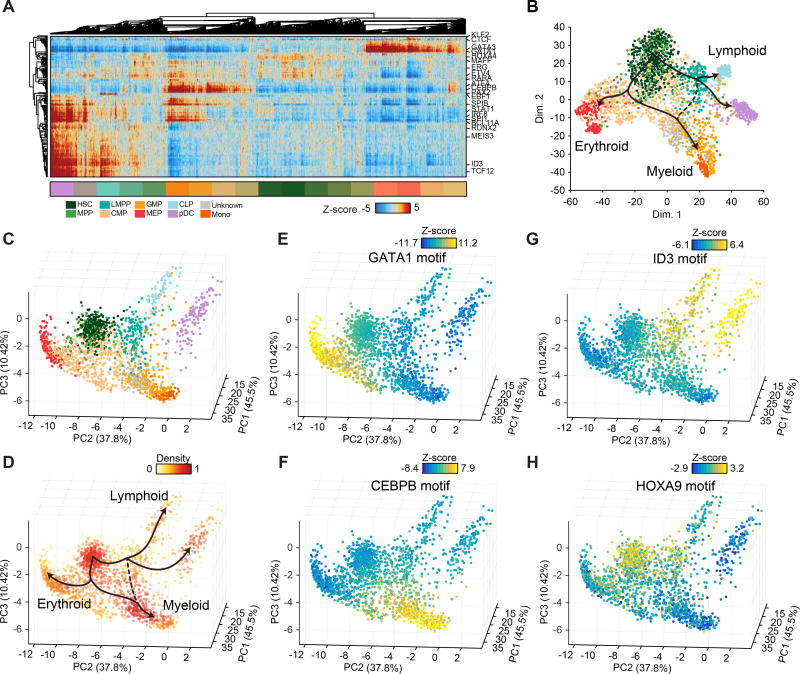
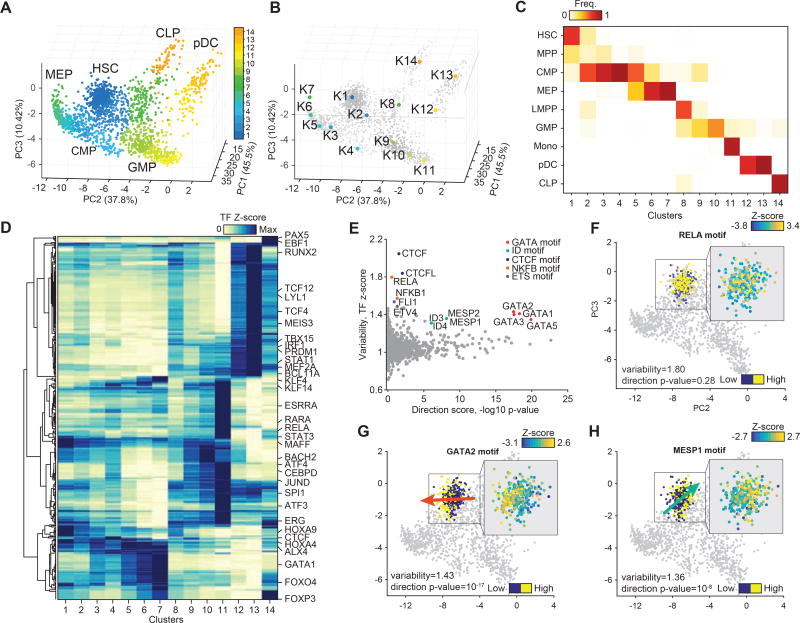
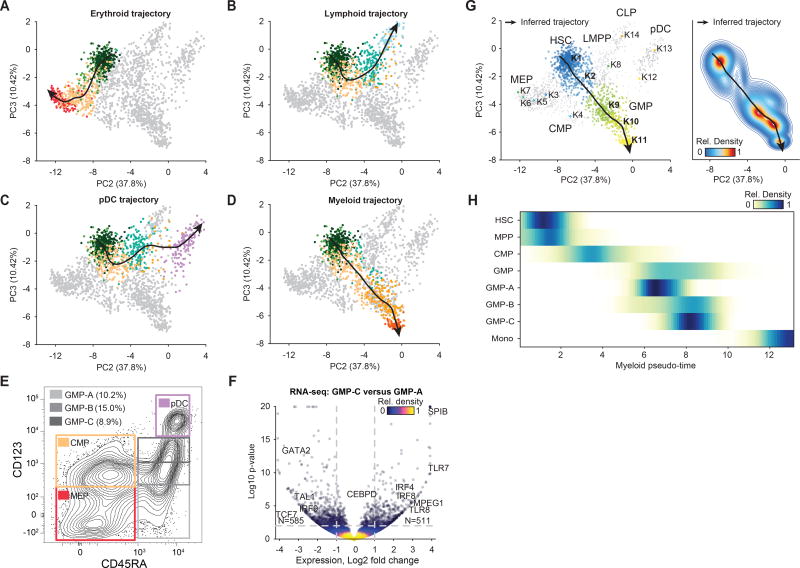
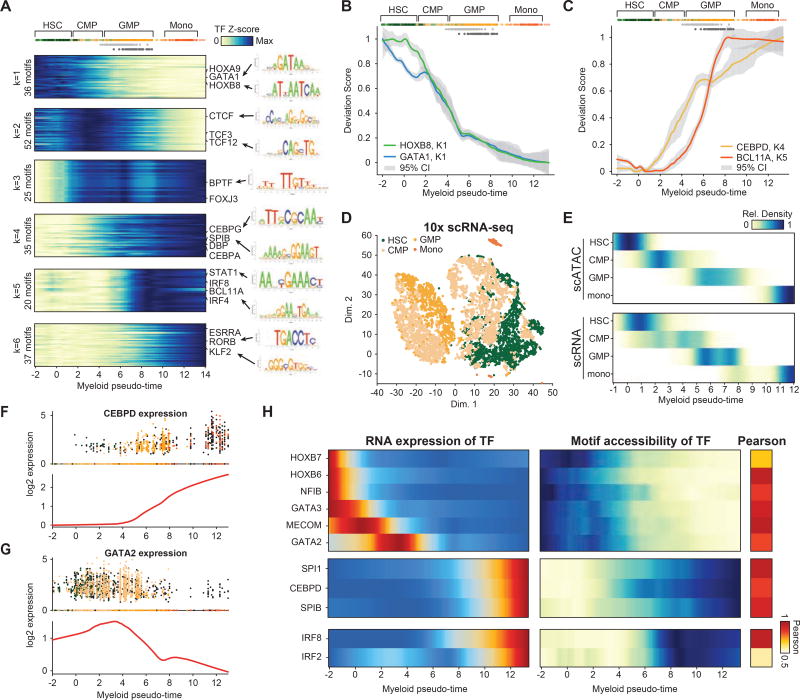
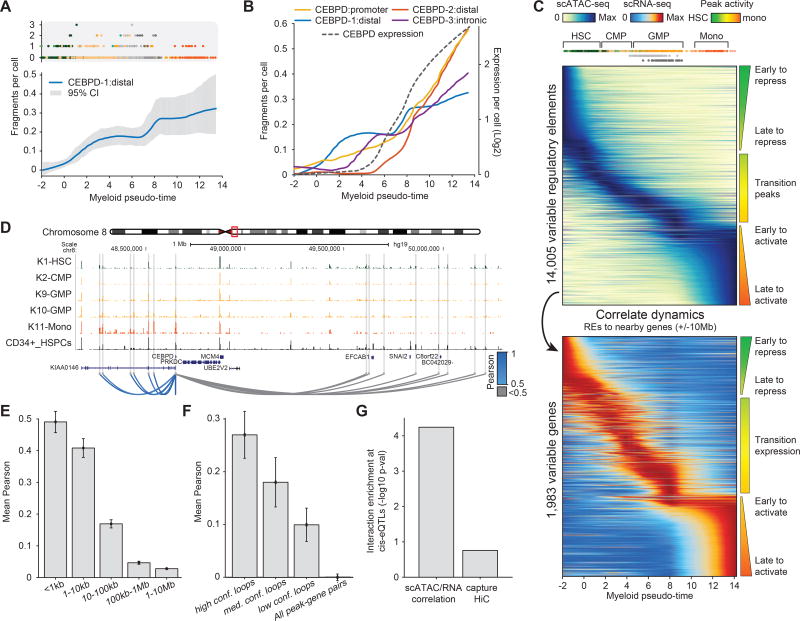
Human hematopoiesis involves cellular differentiation of multipotent cells into progressively more lineage-restricted states. While the chromatin accessibility landscape of this process has been explored in defined populations, single-cell regulatory variation has been hidden by ensemble averaging. We collected single-cell chromatin accessibility profiles across 10 populations of immunophenotypically defined human hematopoietic cell types and constructed a chromatin accessibility landscape of human hematopoiesis to characterize differentiation trajectories. We find variation consistent with lineage bias toward different developmental branches in multipotent cell types. We observe heterogeneity within common myeloid progenitors (CMPs) and granulocyte-macrophage progenitors (GMPs) and develop a strategy to partition GMPs along their differentiation trajectory. Furthermore, we integrated single-cell RNA sequencing (scRNA-seq) data to associate transcription factors to chromatin accessibility changes and regulatory elements to target genes through correlations of expression and regulatory element accessibility. Overall, this work provides a framework for integrative exploration of complex regulatory dynamics in a primary human tissue at single-cell resolution.

Keywords: chromatin accessibility; epigenomics; hematopoiesis; single cell.


Figures

Figure 1
Figure 1. Single-cell ATAC-seq profiles chromatin accessibility within single hematopoietic progenitors
(A) A schematic of human hematopoietic differentiation. (B) Sorting strategy for CD34+ cells. (C) Single-cell ATAC-seq workflow used in this study. (D) Single-cell epigenomic profiles along the TET2 locus. (E) Percent fragments in peaks by number of fragments in peaks, red lines show cutoffs used for determining which cells pass filter; points are colored by density. (F) TF motif variability analysis in all single-cell epigenomic profiles collected for this study.
Figure 2
Figure 2. Lineage projection of human hematopoietic progenitors
(A) (top) Hierarchical clustering of single-cell epigenomic profiles (columns) and TF motif accessibility z-scores (rows), (bottom) single cell profiles colored by their sorted immunophenotype identity. (B) t-SNE of TF z-scores shown in (A), cells are colored by their sorted immunophenotype identify. (C,D) Single-cell epigenomic landscape defined by PCA projection (see methods) colored by (C) cell type identity using immunophenotype and (D) density (see methods) overlaid with nominal trajectories expected from the literature, as shown in Figure 1A. PC projection colored by (E) GATA, (F) CEBPB, (G) ID3 and (H) HOXA9 TF motif accessibility z-scores.
Figure 3
Figure 3. Molecular characterization of data-defined clusters
(A) Single-cell epigenomic landscape defined by PCA projection, colored by data-driven cluster number. (B) Medoids of data-driven centroids depicted on the PCA sub-space. (C) Confusion matrix of data-driven clusters representing the percent frequency of immunophenotypically defined cell types. (D) TF motif accessibility z-scores averaged across data defined clusters and hierarchically clustered. Scores are normalized by the max value of each TF motif. (E) TF motif variability and direction – log10 p-value for each TF motif for the HSC EIPP cluster, TFs sharing a similar motif are highlighted. (F-H) TF motif accessibility z-scores of HSC profiles for (F) RELA, (G) GATA2 and (H) MESP1 motifs, arrows denote the direction of the signal bias and are colored by the target cell type.
Figure 4
Figure 4. Identifying continuous differentiation trajectories
(A–D) PC2 by PC3 projection of single-cells highlighting cells progressing through the inferred (A) erythroid, (B) lymphoid, (C) pDC and (D) myeloid developmental trajectory (black line), cells used for inference are colored by sorted identity, all other cells are shown in grey. (E) Sorting schema for different GMP progenitors defined by CD123 expression, marked by CD123 low (GMP-A, light-grey), CD123 medium (GMP-B, grey) and CD123 high (GMP-C, dark-grey). (F) Bulk RNA-seq log2-fold-change and -(log p-value) for expressed genes comparing GMP-C and GMP-A. (G) Single-cells used for the myeloid trajectory colored by (left) their cluster identity (cluster colors as in Figure 3) or (right) their density along the trajectory. (H) Density of myeloid progression scores for immunophenotypically defined cell types, including the GMP subsets.
Figure 5
Figure 5. Transcription factor dynamics across myeloid differentiation
(A) K-medoids clustering of TF motif accessibility (left) and PWM logos (right) for dynamic TF motif profiles across myeloid development. (B,C) Smoothed profiles of TF motif accessibility z-scores in myeloid progression for (B) HSC active TFs GATA1 (blue) and HOXB8 (green), and (C) monocyte active regulators CEBPD (yellow) and BCL11A (red), error bars (grey) denote 95% confidence intervals. (D) t-SNE of scRNA-seq data showing HSC, CMP, GMP and Monocyte cells. (E) Density of myeloid pseudo-time scores for (top) scATAC-seq and (bottom) computationally matched scRNA-seq profiles (see methods). (F,G) Log2 mean expression profiles for TFs (F) CEBPD and (G) GATA2 across myeloid pseudo-time, (top) individual cells are colored by their sorted identity, CD34+ cells are shown in black and (bottom) smoothed profiles are shown in red. (H) (left) Expression and (right) TF motif accessibility dynamics across myeloid pseudo-time for correlated (R > 0.5) gene-motif pairs.
Figure 6
Figure 6. Regulatory element dynamics links distal elements to genes
(A) Fragments per cell for a CEBPD distal element ordered by myeloid pseudo-time, (top) cells are colored by their sorted identity and (bottom) values are smoothed (blue), error bars (grey) denotes 95% confidence intervals. (B) Cis-regulatory and expression dynamics across four regulatory elements near the myeloid regulator CEBPD. (C) Accessibility (top) and expression (bottom) dynamics across myeloid pseudo-time, rows are sorted by their peak intensity in the myeloid trajectory. (D) Regulatory profiles surrounding the CEBPD gene, dynamic enhancers are highlighted in grey with significant (blue) and non-significant (grey) correlated peak-gene pairs shown as loops. (E,F) Mean Pearson correlation coefficients binned by (E) genomic distance to the gene and (F) loop confidence, error bars represent 1 standard deviation on the estimate of the mean. (G) P-value of enriched peak-gene correlation or promoter capture HiC at cis-eQTLs overlapping dynamic enhancers.

References

    1. Argiropoulos B, Humphries RK. Hox genes in hematopoiesis and leukemogenesis. Oncogene. 2007;26:6766–6776. - PubMed
    1. Becker AJ, McCulloch EA, Till JE. Cytological demonstration of the clonal nature of spleen colonies derived from transplanted mouse marrow cells. Nature. 1963;197:452–454. - PubMed
    1. Brennecke P, Anders S, Kim JK, Kołodziejczyk AA, Zhang X, Proserpio V, Baying B, Benes V, Teichmann SA, Marioni JC, et al. Accounting for technical noise in single-cell. RNA-seq experiments. 2013;10:1093–1095. - PubMed
    1. Buenrostro JD, Giresi PG, Zaba LC, Chang HY, Greenleaf WJ. Transposition of native chromatin for fast and sensitive epigenomic profiling of open chromatin, DNA-binding proteins and nucleosome position. Nat. Methods. 2013;10:1213–1218. - PMC - PubMed
    1. Buenrostro JD, Wu B, Chang HY, Greenleaf WJ. ATAC-seq: A Method for Assaying Chromatin Accessibility Genome-Wide. Curr Protoc Mol Biol. 2015a;109 21.29.1–.29.9. - PMC - PubMed

Publication types