. 2018 Jun 5;27(6):1249-1262.e4.
doi: 10.1016/j.cmet.2018.04.003. Epub 2018 Apr 26.

Aldolase B-Mediated Fructose Metabolism Drives Metabolic Reprogramming of Colon Cancer Liver Metastasis

Affiliations

Aldolase B-Mediated Fructose Metabolism Drives Metabolic Reprogramming of Colon Cancer Liver Metastasis

Pengcheng Bu et al. Cell Metab. .

Abstract

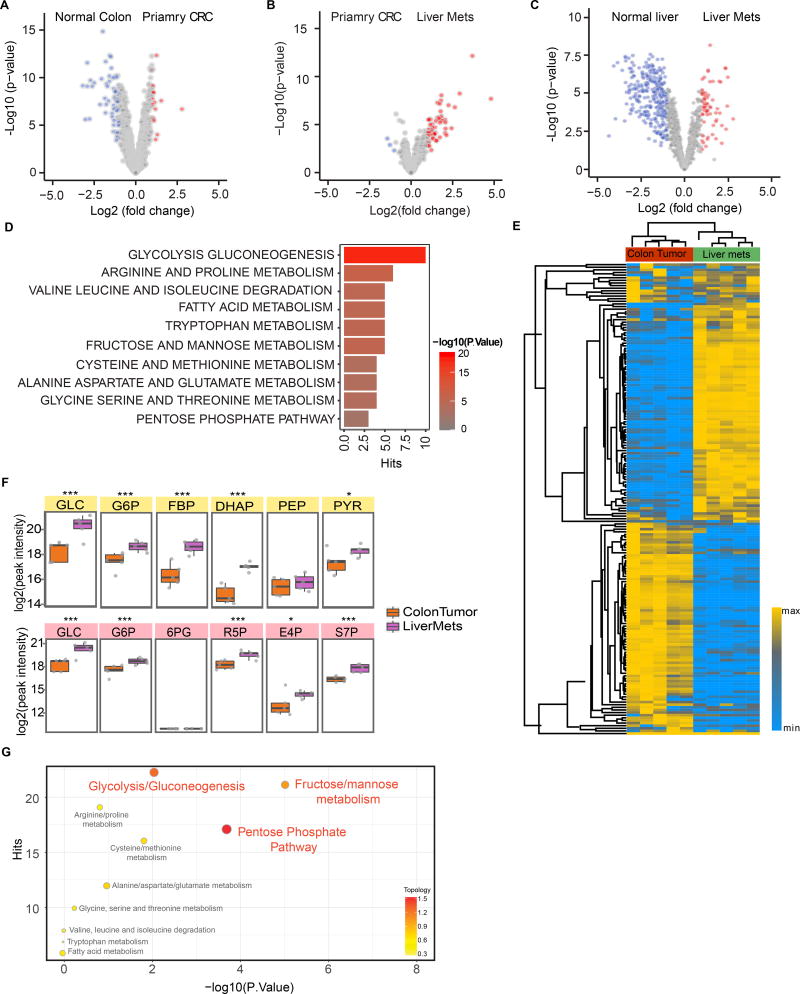
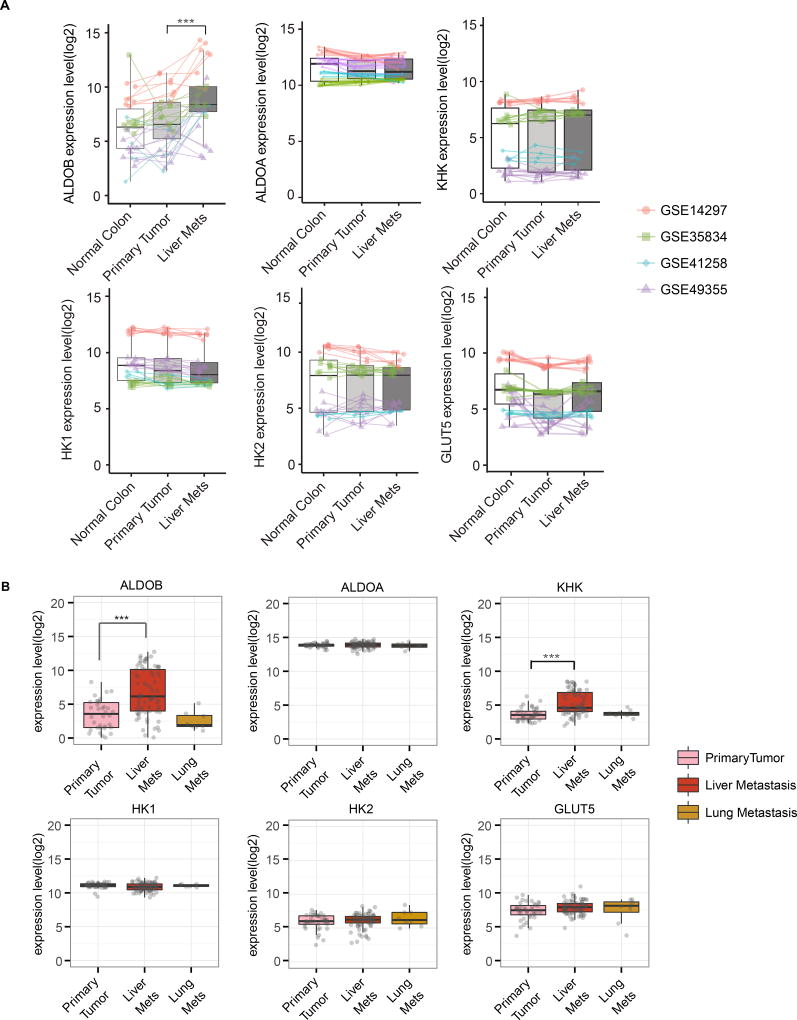
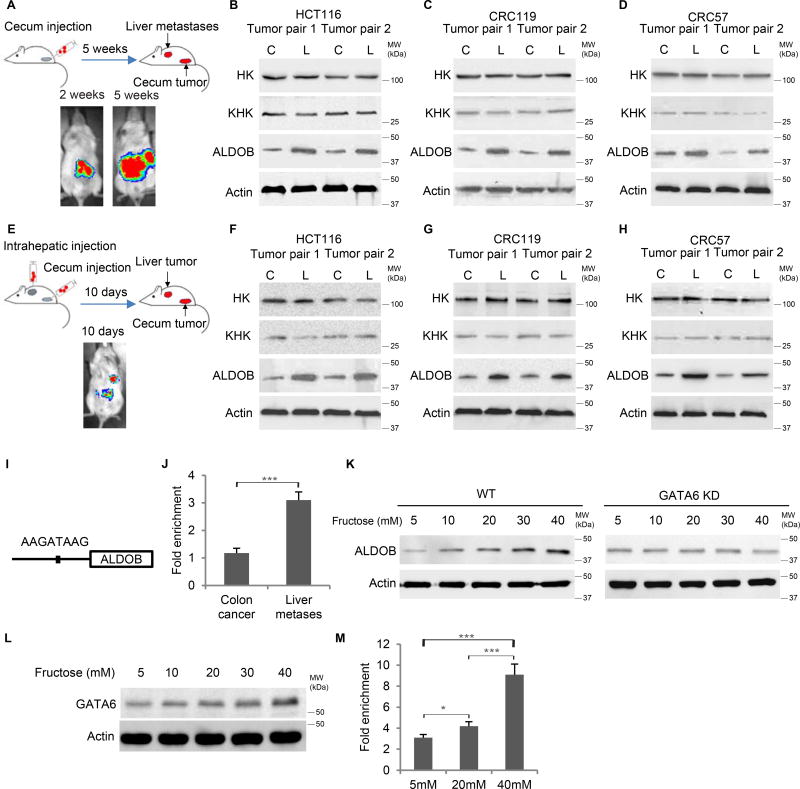
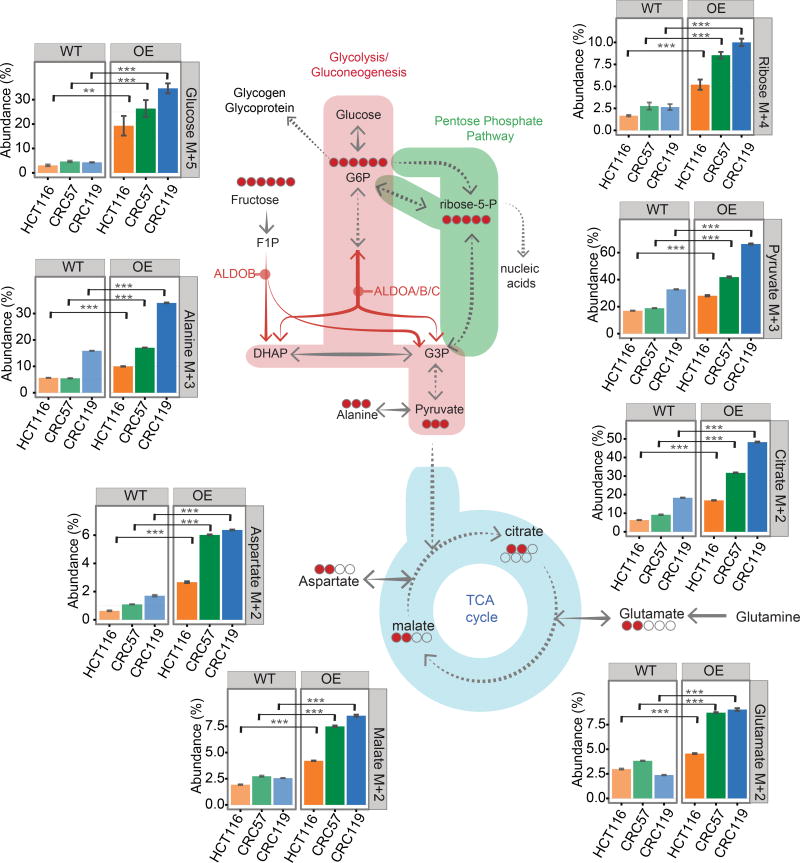
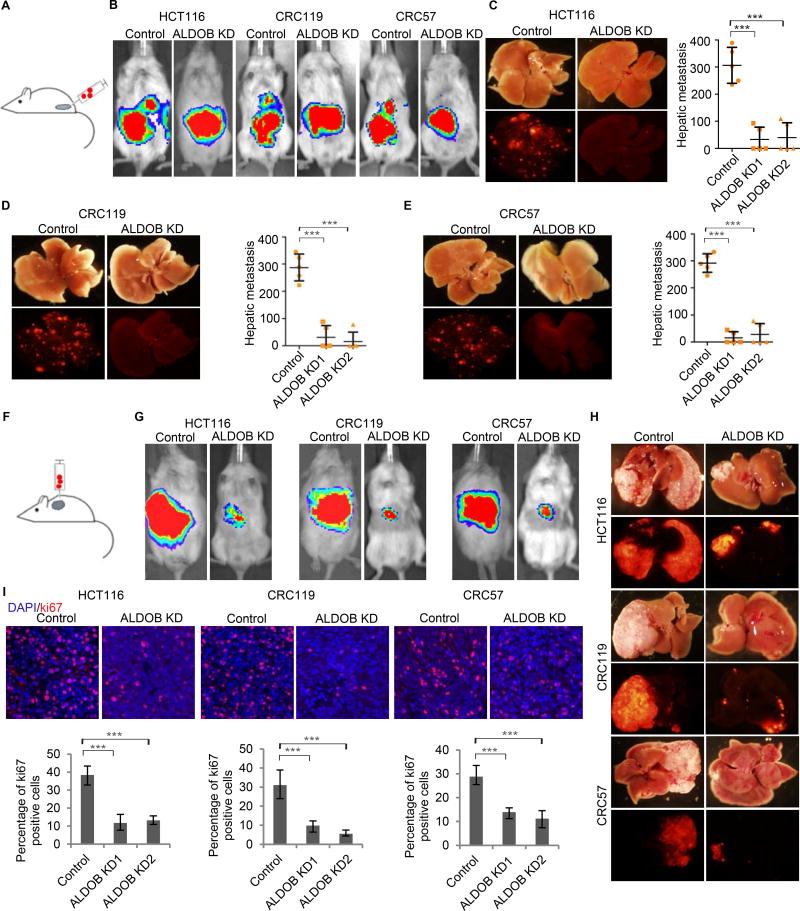
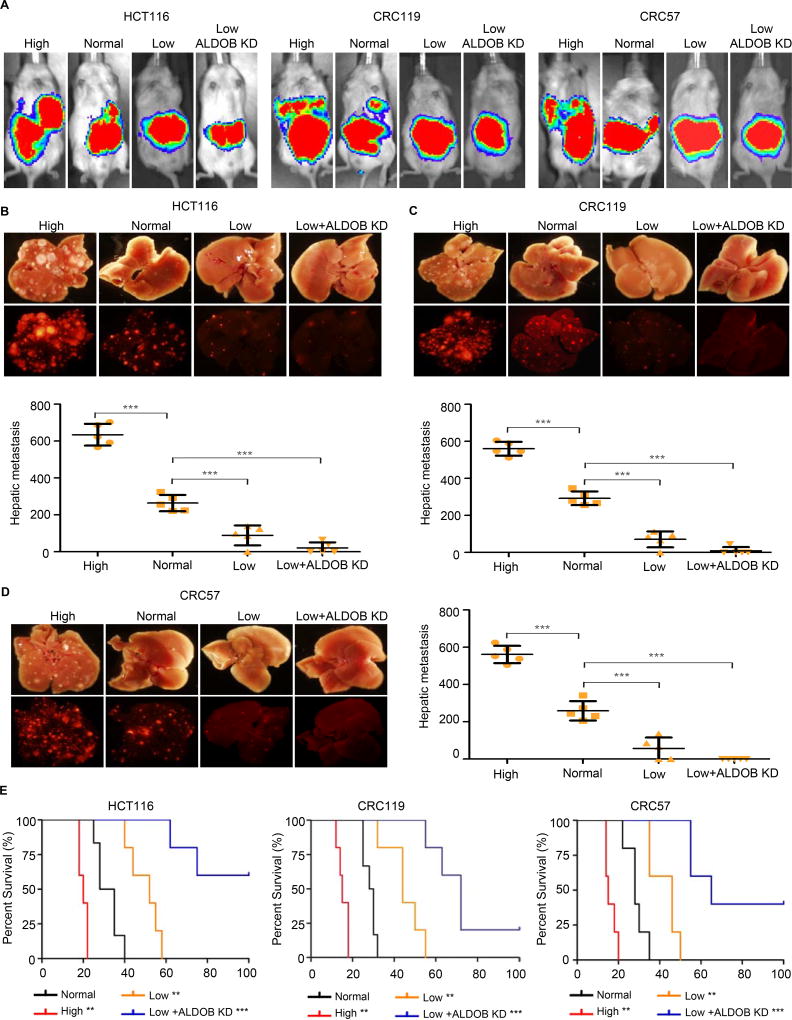
Cancer metastasis accounts for the majority of cancer-related deaths and remains a clinical challenge. Metastatic cancer cells generally resemble cells of the primary cancer, but they may be influenced by the milieu of the organs they colonize. Here, we show that colorectal cancer cells undergo metabolic reprogramming after they metastasize and colonize the liver, a key metabolic organ. In particular, via GATA6, metastatic cells in the liver upregulate the enzyme aldolase B (ALDOB), which enhances fructose metabolism and provides fuel for major pathways of central carbon metabolism during tumor cell proliferation. Targeting ALDOB or reducing dietary fructose significantly reduces liver metastatic growth but has little effect on the primary tumor. Our findings suggest that metastatic cells can take advantage of reprogrammed metabolism in their new microenvironment, especially in a metabolically active organ such as the liver. Manipulation of involved pathways may affect the course of metastatic growth.

Keywords: ALDOB; Aldolase B; GATA6; colon cancer; colorectal cancer; fructose; liver; metabolic reprogramming; metabolism; metastasis.


Figures

Figure 1
Figure 1. Comparison of metabolic states of primary CRC and liver metastasis
(A and B) Volcano plots of differential metabolic gene expression between paired normal colon and primary CRC (A) and paired primary CRC and liver metastases (B) samples from 30 CRC liver metastasis patients selected from 4 public GEO datasets (Table S1A). (C) Volcano plots of differential metabolic gene expression between paired CRC liver metastases and normal liver samples from 9 CRC liver metastasis patients selected from GSE41258 and GSE14297 (Table S1A). Each circle represents a gene. Red color refers to significantly upregulated genes (p value < 0.05 and fold change >2) while blue color refers to significantly downregulated genes (p value < 0.05 and fold change >2). (D) Gene Set Enrichment Analysis (GSEA) of upregulated metabolic pathways in liver metastases based on comparison of the paired samples. (E) Heatmap of metabolite clusters in primary colon tumor and liver metastases measured by LC-MS based metabolomics. (F) Representation of the upregulated glycolysis/gluconeogenesis (top) and pentose phosphate (bottom) pathways and MS peak intensity of their corresponding intermediate metabolites. *, p<0.05; ***, p<0.001. p-value was calculated based on linear model. (G) Integrated pathway analysis of transcriptomic and metabolomics data. The significantly enriched (p value < 0.05, fold change >1) genes from RNA-seq and significantly enriched (p value < 0.05, fold change >1) metabolites from metabolomics comparing liver metastases samples to primary tumor samples were integrated by combining hypergeometric test for enrichment analysis and degree centrality in topology analysis based on gene-metabolite pathways using Metabolyst. The identified enrichment pathway list is compared with the clinical enriched pathway (Figure 1D) and the consistently enriched pathways are shown. x axis: p values from hypergeometric test, y axis: hits refers to the number of upregulated metabolites/genes overlapping with the ones in the metabolic pathway. Color bar refers to the topology analysis that calculates the importance of the genes and metabolites on its position within a metabolic pathway based on degree centrality. See also Figure S1.
Figure 2
Figure 2. Liver metastases upregulate ALDOB
(A) Paired box plots comparing expression levels of ALDOB, ALDOA, KHK, HK1, HK2 and GLUT5 between matched samples of normal colon, primary CRC, and liver metastases from 30 patients in 4 GEO datasets (Table S1A). Dots refer to different samples, and lines connect the paired samples. Different colors refer to different datasets. ***, p<0.001. p-values were calculated based on paired linear model using Limma. (B) Analysis of the expression levels of ALDOB, ALDOA, KHK, HK1, HK2 and GLUT5 in 39 primary colon carcinoma, 74 liver metastatic and 8 lung metastatic samples from stage IV CRC patients in GSE41568. p-values were calculated based on linear model using Limma. ***, p<0.001. See also Figure S2.
Figure 3
Figure 3. Liver metastasis upregulates ALDOB in vivo
(A) Schematic and representative IVIS luciferase in vivo images of the orthotopic/metastatic cecum injection mouse model. (B-D) Western blot showing ALDOB expression increased in liver metastases compared to primary cecum tumors derived from cecum-injected HCT116 (B), CRC119 (C) and CRC57 (D) cells. (E) Schematic and representative IVIS luciferase in vivo images of simultaneous cecum and intrahepatic injection mouse model. (F-H) Western blot showing higher ALDOB expression in liver tumors than in cecum tumors from HCT116 (F), CRC119 (G) and CRC57 (H) cells. (I) Schematic of GATA6 binding motif in ALDOB promoter. (J) ChIP-qPCR showing enrichement of GATA6 binding to the ALDOB promoter in CRC cells isolated from liver metastases compared to those from primary cecum tumors. Signals were normalized with Actin (input). The fold changes were calculated by normalized with IgG control antibody. (K) Western blot showing upregulation of ALDOB in response to fructose under hypoxia is dependent on GATA6. (L) Western blot showing GATA6 expression in response to fructose under hypoxia. (M) ChIP-qPCR showing enrichment of GATA6 binding to the ALDOB promoter in CRC cells in response to fructose under hypoxia. Signals were normalized by Actin (input). The fold changes were calculated based on normalization with IgG control antibody. Error bars denote s.d. of triplicates. *, p<0.05; ***, p<0.001. See also Figure S3
Figure 4
Figure 4. ALDOB regulates fructose metabolism
Tracing analysis using 13C labeled fructose by GC-MS. 13C labeled carbon was analyzed after cells were incubated in 13C labeled fructose-containing medium (8 mM [U-13C] fructose, 0 mM glucose) for 24 hours. WT: control; OE: ectopic ALDOB expression. The bar diagrams show the abundance (%) of isotopomers of glucose (M+5), ribose (M+4), pyruvate (M+3), alanine (M+3), citrate (M+2), glutamate (M+2), malate (M+2) and aspartate (M+2). The abundance represents the percentage of the corresponding isotopomer (e.g. pyruvate M+3) among all isotopomers of the metabolite (e.g. pyruvate: M+0, M+1, M+2, M+3). The isotopomer distributions have been corrected for natural isotope abundances. Error bars denote s.d. of triplicates. p-values were calculated based on Student's t-test. **, p<0.01; ***, p<0.001. The schematic diagrams show the corresponding isotopomer transition from 13C labeled fructose, and the red circles represents the number of detected 13C labeled carbons in the intermediate metabolites. For glucose and ribose, the fragmentation in mass spectrometry resulted in the loss of one carbon, therefore the bar diagrams denote M+5 for glucose and M+4 for ribose. See also Figure S4.
Figure 5
Figure 5. Silencing of ALDOB suppresses CRC liver metastasis
(A) Schematic of the cecum injection model. (B-E) Analysis of CRC liver metastasis in mice with cecum injection of HCT116, CRC119, and CRC57 cells carrying dual luciferase/fluorescent reporter constructs. Representative IVIS luciferase in vivo images (B), bright field and fluorescent images of livers, and quantification of liver metastasis (C–E) show ALDOB knockdown suppressed liver metastasis. (F) Schematic of the intrahepatic injection model. (G and H) Analysis of CRC growth in liver with intrahepatic injection of HCT116, CRC119, and CRC57 cells carrying dual luciferase/fluorescence reporter constructs. Representative IVIS luciferase in vivo images (G) and bright-field and fluorescent images of livers (H) show ALDOB knockdown suppressed CRC growth in the liver. (I) Representative Ki67 staining images and percentage of Ki67+ cells in CRC liver metastases showing ALDOB knockdown suppressed CRC cells proliferation in the liver. Error bars denote s.d. of 5 mice per group. ***, p<0.001. p-values were calculated based on one-way ANOVA. See also Figure S5 and S6.
Figure 6
Figure 6. Dietary fructose restriction suppresses CRC liver metastasis
(A) Representative IVIS luciferase in vivo images of mice with CRC cell HCT116, CRC119 and CRC57 injected in cecum and fed with a regular diet (Normal), a fructose-high diet (High), a fructose-restricted diet (Low), or a fructose restricted diet + ALDOB knockdown (Low+ALDOB KD). (B-D) Bright field and fluorescent images of liver tissue from the mice in (A). Liver metastasis was quantified using the Image J software. Error bars denote s.d. of 5 mice per group. p-values were calculated based on one-way ANOVA. (E) Survival curves of mice intrahepatically injected with CRC cells and fed with a regular diet (Normal), a fructose-high diet (High), a fructose-restricted diet (Low), or a fructose restricted diet + ALDOB knockdown (Low+ALDOB KD). p value was calculated in comparison with normal diet group on the base of log-rank test. **, p<0.01; ***, p<0.001. See also Figure S5 and S6; Table S5.

Comment in

References

    1. Abdelmalek MF, Lazo M, Horska A, Bonekamp S, Lipkin EW, Balasubramanyam A, Bantle JP, Johnson RJ, Diehl AM, Clark JM, et al. Higher dietary fructose is associated with impaired hepatic adenosine triphosphate homeostasis in obese individuals with type 2 diabetes. Hepatology. 2012;56:952–960. - PMC - PubMed
    1. Abdelmalek MF, Suzuki A, Guy C, Unalp-Arida A, Colvin R, Johnson RJ, Diehl AM Nonalcoholic Steatohepatitis Clinical Research, N. Increased fructose consumption is associated with fibrosis severity in patients with nonalcoholic fatty liver disease. Hepatology. 2010;51:1961–1971. - PMC - PubMed
    1. Ahn WS, Antoniewicz MR. Metabolic flux analysis of CHO cells at growth and non-growth phases using isotopic tracers and mass spectrometry. Metab Eng. 2011;13:598–609. - PubMed
    1. Alberts SR, Horvath WL, Sternfeld WC, Goldberg RM, Mahoney MR, Dakhil SR, Levitt R, Rowland K, Nair S, Sargent DJ, et al. Oxaliplatin, Fluorouracil, and Leucovorin for Patients With Unresectable Liver-Only Metastases From Colorectal Cancer: A North Central Cancer Treatment Group Phase II Study. Journal of Clinical Oncology. 2005;23:9243–9249. - PubMed
    1. Anders S, Pyl PT, Huber W. HTSeq--a Python framework to work with high-throughput sequencing data. Bioinformatics. 2015;31:166–169. - PMC - PubMed