. 2018 Apr 12:12:28.
doi: 10.3389/fncir.2018.00028. eCollection 2018.

Plasticity in One Hemisphere, Control From Two: Adaptation in Descending Motor Pathways After Unilateral Corticospinal Injury in Neonatal Rats

Affiliations

Plasticity in One Hemisphere, Control From Two: Adaptation in Descending Motor Pathways After Unilateral Corticospinal Injury in Neonatal Rats

Tong-Chun Wen et al. Front Neural Circuits. .

Erratum in

Abstract

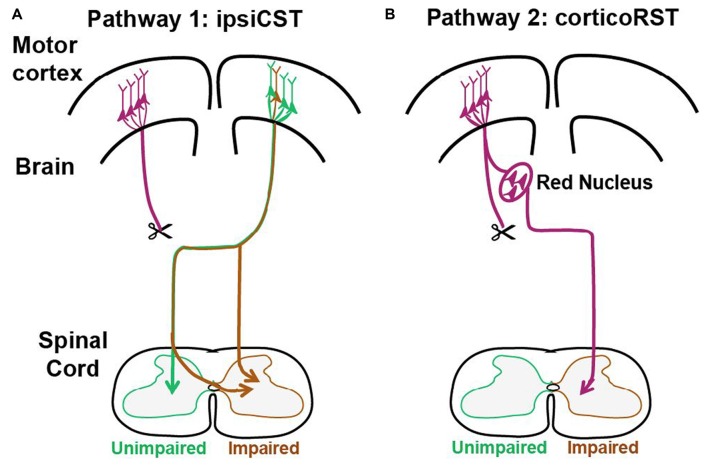
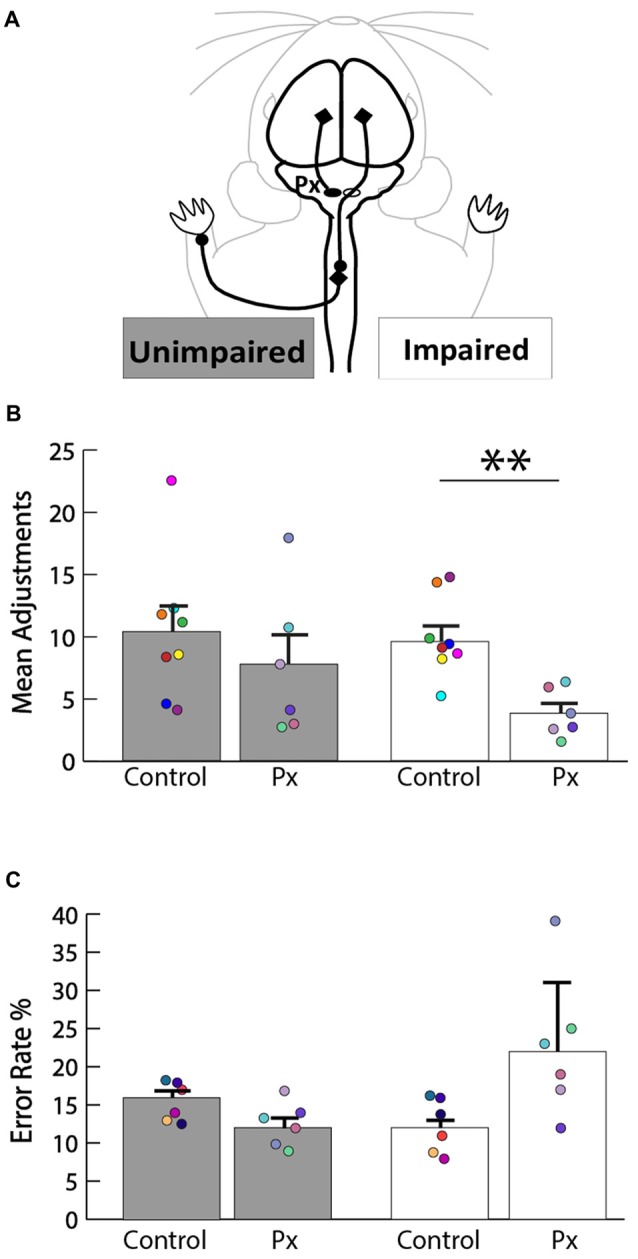
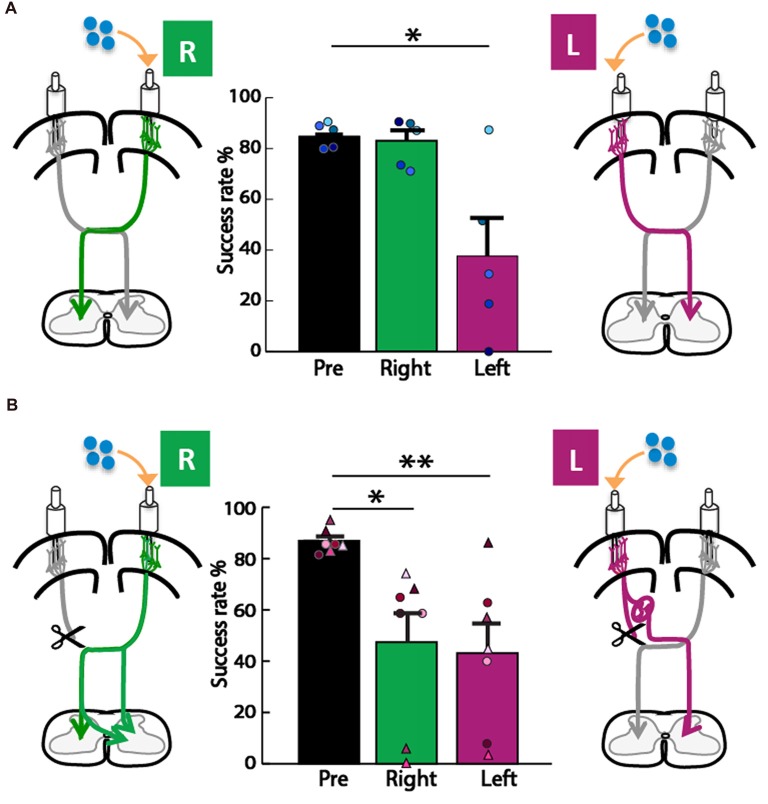
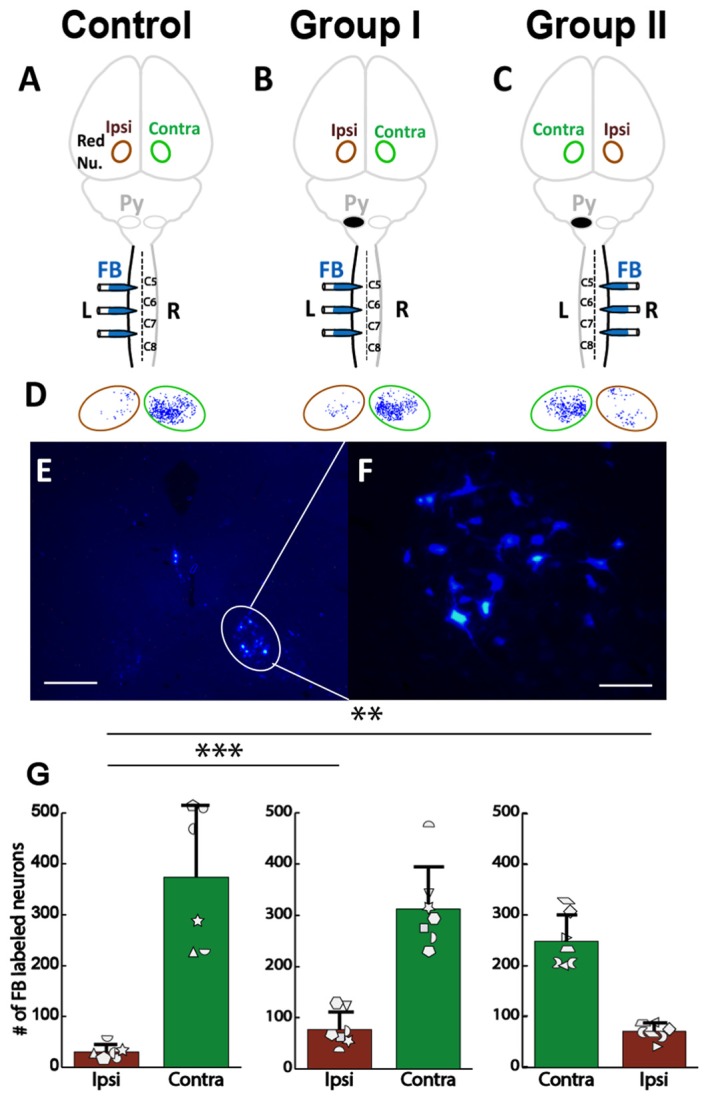
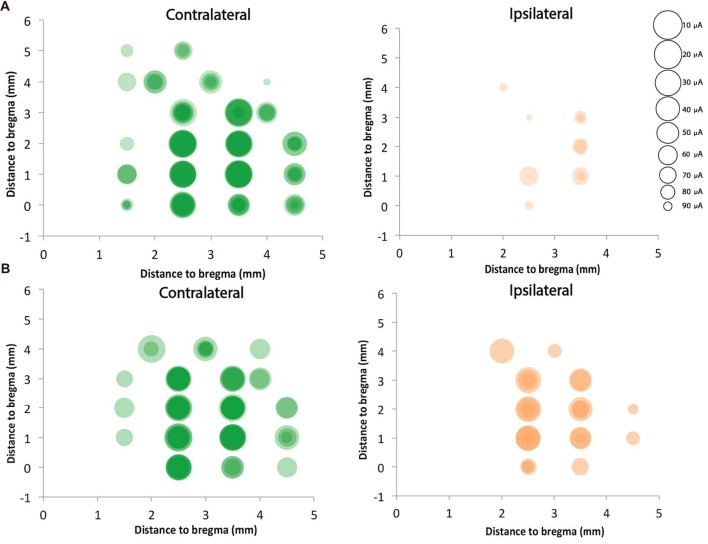
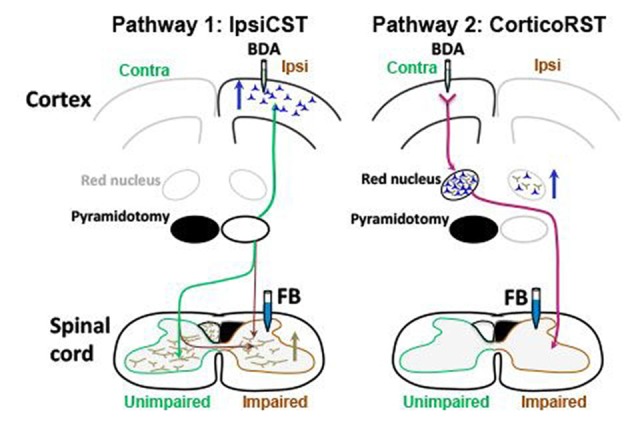
After injury to the corticospinal tract (CST) in early development there is large-scale adaptation of descending motor pathways. Some studies suggest the uninjured hemisphere controls the impaired forelimb, while others suggest that the injured hemisphere does; these pathways have never been compared directly. We tested the contribution of each motor cortex to the recovery forelimb function after neonatal injury of the CST. We cut the left pyramid (pyramidotomy) of postnatal day 7 rats, which caused a measurable impairment of the right forelimb. We used pharmacological inactivation of each motor cortex to test its contribution to a skilled reach and supination task. Rats with neonatal pyramidotomy were further impaired by inactivation of motor cortex in both the injured and the uninjured hemispheres, while the forelimb of uninjured rats was impaired only from the contralateral motor cortex. Thus, inactivation demonstrated motor control from each motor cortex. In contrast, physiological and anatomical interrogation of these pathways support adaptations only in the uninjured hemisphere. Intracortical microstimulation of motor cortex in the uninjured hemisphere of rats with neonatal pyramidotomy produced responses from both forelimbs, while stimulation of the injured hemisphere did not elicit responses from either forelimb. Both anterograde and retrograde tracers were used to label corticofugal pathways. There was no increased plasticity from the injured hemisphere, either from cortex to the red nucleus or the red nucleus to the spinal cord. In contrast, there were very strong CST connections to both halves of the spinal cord from the uninjured motor cortex. Retrograde tracing produced maps of each forelimb within the uninjured hemisphere, and these were partly segregated. This suggests that the uninjured hemisphere may encode separate control of the unimpaired and the impaired forelimbs of rats with neonatal pyramidotomy.

Keywords: corticospinal tract; deficits; neonatal pyramidotomy; plasticity; rats; rubrospinal tract.


Figures

Figure 1
Figure 1
Candidate circuits for recovery of corticospinal tract (CST) function after neonatal pyramidotomy. We created unilateral CST injury by cutting the left CST at the level of the pyramid in the P7 rat. We then examined which spared motor connections adapt to CST injury. (A) One candidate spared motor pathway is the CST on the uninjured side of the brain, which has sparse projections to the ipsilateral and impaired side of the spinal cord (ipsiCST). (B) Another candidate motor pathway is bypass circuit from the motor cortex on the injured side to the ipsilateral red nucleus; the rubrospinal tract (RST) then crosses to the spinal cord on the impaired side cortico-rubrospinal tract (corticoRST). Scissors showed the cut.
Figure 2
Figure 2
Images of lesions of all rats used in the study. (A1–7) Group I for tracing and intracortical microstimulation (ICMS); (B1–7) Group II only for tracing; (C1–7) supination task and motor cortex inactivation; (D1–3) pasta manipulation and ladder walking. The top row is the ventral view of the whole brain; the arrow shows the cut lesion. The second row shows dark-field images of coronal section through the cut level. The red line shows the approximate position of the pyramid that was the cut. The bottom rows in (C4–7) show protein kinase C-γ (PKC-γ) staining in the dorsal column with the percentage of CST spared after neonatal pyramidotomy. Bar = 4 mm (top row in D3), 12.5 mm (bottom row in D3), 5 mm (the third row in C7).
Figure 3
Figure 3
Motor deficits in rats with neonatal pyramidotomy. (A) Schematic of the intact CST that contributes to function of the unimpaired (left forepaw) and the impaired (right forepaw) forelimbs. (B) Pasta manipulation. The rats with neonatal pyramidotomy (Px) made fewer adjustments with their right forepaw than the control rats. No significant differences were detected in the amount of adjustments made by the left forepaw between the control and the Px rats. (C) Ladder walking. The right forepaw of the Px rats had a greater error rate percentage compared to that of the controls; however, left forepaw placement error was similar in the control and the Px rats. In addition, there were greater errors made with the right forepaw than the left forepaw in the Px rats. Data = mean ± SEM. Plotted dots represent each rat’s behavioral data points in each group. Each rat’s data are identified by the color of the dot. **p < 0.01.
Figure 4
Figure 4
Forelimb motor control from both hemispheres in adult rats with neonatal pyramidotomy. (A) Control group. Muscimol, shown in blue, was injected into the left (L) or right (R) motor cortex. In the control rats, there was no significant difference between baseline performance (black, pre) and performance (green, right) after right motor cortex inactivation. Performance after left motor cortex inactivation (magenta, left) was significantly reduced compared to baseline performance (black, pre). Plotted dots in different shades of blue represent each rat’s success rate data points. (B) Neonatal pyramidotomy. Compared to baseline performance (black, pre), rats with neonatal pyramidotomy showed deficits in performance after both right (green, right) and left motor cortex (magenta, left) inactivation. In addition, rats with neonatal pyramidotomy showed larger impairments on the supination task than the controls after receiving right motor cortex inactivation. Plotted dots and triangles in different shades of pink represent each rat’s success rate data points. Dots in shades of pink indicate complete pyramidotomy and triangles represent rats with incomplete pyramidotomy. *p < 0.05, **p < 0.01.
Figure 5
Figure 5
No differences in injections of Fast Blue (FB) into spinal cord among three groups. (A) Control rats received four injections of the anterograde tracer biotin-dextran (BDA) into the left (L) primary cortex and three injections of the retrograde tracer FB into the left side of the spinal cord. Red Nu., red nucleus. (B) Group I rats with neonatal pyramidotomy (indicated by the black oval next to pyramid, Py) received BDA injections into the left primary cortex and the FB injections into the left side of the spinal cord. (C) Group II rats with neonatal pyramidotomy received BDA injections into the right (R) primary cortex and the FB injections into the right side of the spinal cord. (D–F) Representative images of FB injections in the control rats and the rats with pyramidotomy. The dotted lines show the gray matter in the spinal cord. Bar = 0.5 mm. (G–I) Heat maps of distribution of FB in the spinal cord of C5, C6 and C7 of the control rats and the rats with neonatal pyramidotomy. Note the similar distribution among three groups.
Figure 6
Figure 6
Cortical maps showed large increase in ipsilateral representation, especially in the rostral forelimb area (RFA), and loss of contralateral representation. (A–D) Experimental schema of injections of FB, pyramid (Py) cut, and shading of the cortex that was analyzed. (A,C) Control rat with FB injection into the left (L) side of the spinal cord; this was one group of rats, but each hemisphere was compared against a different group (Group I and Group II) of the rats with neonatal pyramitomy. The contralateral (Contra) hemisphere was compared against Group I, and the ipsilateral (Ipsi) hemisphere was compared against Group II. (B) Group I rats with FB injection into the left (unimpaired) side of the spinal cord. (D) Group II rats with FB injection into the right (impaired) side of the spinal cord. (E,F) FB-labeled neurons in the motor cortex (1.5 mm rostral to bregma) of a representative rat from Group II. Bar = 250 μm (E) or 50 μm (F). (G) Maps of distribution of the FB-labeled neurons in the cortex of the control rats and the rats with neonatal pyramidotomy. The + symbol indicates bregma. (H) Heat maps of probability density distribution of the FB-labeled neurons in the cortex of the control rats and the rats with neonatal pyramidotomy. Dark red indicates high probability (approach 1) and dark blue indicates low probability (approaching 0) There were two distinct representations in the rats with neonatal pyramidotomy, the (RFA, indicated by the arrows) and the caudal forelimb area (CFA) in the ipsilateral cortex. (I) The number of the FB-labeled neurons in the cortex. Note that the FB-labeled neurons in the ipsilateral cortex were significantly increased in the rats with neonatal pyramidotomy in comparison to the control rats; however, the numbers in the contralateral cortex were significantly reduced. Plotted white shapes represent the number for each rat in each group. Each rat’s data corresponds to a type and orientation of shape. Data = mean ± SD. *p < 0.05, ***p < 0.005, significant compared to the corresponding values in the control rats.
Figure 7
Figure 7
Strong bilateral connections from the motor cortex of the uninjured hemisphere after neonatal pyramidotomy. (A,B) Experimental schema of injections of BDA, pyramid (Py) cut, and the analysis of the spinal cords in the Control (A) and Group II (B). (C,D) BDA-labeled axons in the spinal cords of the Control (C) and Group II (D). Bar = 250 μm. (E) Average BDA-labeled axon length in the spinal cords of the Control and the Group II. Note that there were significant differences in the distribution and the length of the BDA-labeled axons in the ipsilateral side, but not in the contralateral side of the spinal cord between the Control and the Group II. Plotted white shapes represent each rat’s data points. Each rat’s data corresponds to a type and orientation of shape. (F,G) Heat maps of probability density distribution of the BDA-labeled axons in the spinal cords of the Control (F) and the Group II (G). Note that the scale is logarithmic. In Group I, the pyramidotomy removed all of the CST axons from the injured hemisphere; therefore, Group I was not shown here. ***p < 0.005, significant compared to the same side of the Control.
Figure 8
Figure 8
No increase in the corticorubral axons from the injured hemisphere after neonatal pyramidotomy. (A–C) Experimental schema of injections of BDA, pyramid (Py) cut, and the analyzed sides of the red nucleus (Red Nu.) in the Control (A), Group I (B) and Group II (C). (D) The BDA-labeled axons in the red nucleus. Brown circle shows the BDA injected side; the green one the uninjected side. Bar = 125 μm. (E) Average BDA-labeled axon length in parvocellular red nucleus. There were no differences in the injected or in the uninjected side of the red nucleus among three groups. (F) Average BDA-labeled axon length in magnocellular red nucleus. There were no differences in the injected or in the uninjected side of the red nucleus among three groups. (E,F) Plotted white shapes correspond to each rat’s data points. Each rat’s data in the Control group, Group I and Group II were represented by a particular shape.
Figure 9
Figure 9
No increase in rubrospinal connections in the corticoRST circuit. (A–C) Experimental schema of injections of FB, pyramid (Py) cut, and analysis of the red nucleus (Red Nu.) sites. (A) Control with FB injection into the left side of the spinal cord; (B) Group I with FB injection into the left side (unimpaired) of the spinal cord. (C) Group II with FB injection into the right side (impaired) of the spinal cord. We analyzed the FB-labeled neurons in both the contralateral (Contra) and the ipsilateral (Ipsi) red nucleus of the control and the rats with neonatal pyramidotomy. (D,E) FB-labeled neurons in the red nucleus. Bar = 250 μm (D) or 50 μm (E). (F) Maps of distribution of the FB-labeled neurons in the red nucleus in the Control, Group I and Group II. Green circles represent the contralateral (to the injection) red nucleus, and the brown circles the ipsilateral red nucleus. (G) The mean number of the FB-labeled neurons in the red nucleus. Note that no significant differences were detected in the contralateral red nucleus (green bars) among three groups; however, a significant increase was noted in the ipsilateral red nucleus after neonatal pyramidotomy in comparison to the Control (brown bars). There was no difference in the contralateral or in the ipsilateral red nucleus between Group I and Group II. Plotted white shapes correspond to each rat’s data points. Each rat’s data in the Control group, Group I, and Group II were represented by a particular shape. **p < 0.01, ***p < 0.005.
Figure 10
Figure 10
Strong ipsilateral representation after neonatal pyramidotomy. ICMS was performed on four control rats and four rats with neonatal pyramidotomy. Twenty-three sites were mapped in the right cortex, which was in the uninjured hemisphere of rats with neonatal pyramidotomy. Responses from both forelimbs (contralateral and ipsilateral) were recorded. The sizes of the circles were inversely proportional to the threshold for provoking a movement, as indicated in the scale at right. Responses in individual rats were shaded a light color, and the darkness of the circles indicated how many rats of the four rats had responses at each site. In control rats (A), the responses were mainly on the contralateral forelimb. However, in the rats with neonatal pyramidotomy (B), stronger responses were noted in the ipsilateral forelimb in comparison to that of the control rats. In contrast, the responses from the contralateral forelimb of the rats with neonatal pyramidotomy were less robust than that of the control rats.
Figure 11
Figure 11
Summary of anatomical results. Blue arrows indicate increased number of neurons retrogradely labeled with FB, and the brown arrow indicates increased axons anterogradely labeled with BDA. The ipsiCST was strengthened in rats with neonatal pyramidotomy. FB-labeled neurons were significantly increased in the ipsilateral (Ipsi) hemisphere when FB was injected into the impaired side of the spinal cord, and BDA-labeled axons were significantly increased in the impaired side of the spinal cord when BDA was injected into the ipsilateral hemisphere. In contrast, there were no differences in the corticoRST circuits from the injured hemisphere. The number of the FB-labeled neurons or the BDA-labeled axons in the red nucleus on the injured side was unchanged. There was an increase of retrogradely labeled neurons in the red nucleus in the uninjured hemisphere from the impaired side of the spinal cord. This is not part of the hypothesized corticoRST recovery circuit.

Similar articles

Cited by

References

    1. Allred R. P., Adkins D. L., Woodlee M. T., Husbands L. C., Maldonado M. A., Kane J. R., et al. . (2008). The vermicelli handling test: a simple quantitative measure of dexterous forepaw function in rats. J. Neurosci. Methods 170, 229–244. 10.1016/j.jneumeth.2008.01.015 - DOI - PMC - PubMed
    1. Baker S. N., Perez M. A. (2017). Reticulospinal contributions to gross hand function after human spinal cord injury. J. Neurosci. 37, 9778–9784. 10.1523/JNEUROSCI.3368-16.2017 - DOI - PMC - PubMed
    1. Baker S. N., Zaaimi B., Fisher K. M., Edgley S. A., Soteropoulos D. S. (2015). Pathways mediating functional recovery. Prog. Brain Res. 218, 389–412. 10.1016/bs.pbr.2014.12.010 - DOI - PubMed
    1. Barthas F., Kwan A. C. (2017). Secondary motor cortex: where ‘sensory’ meets ‘motor’ in the rodent frontal cortex. Trends Neurosci. 40, 181–193. 10.1016/j.tins.2016.11.006 - DOI - PMC - PubMed
    1. Bilgen M., Peng W., Al-Hafez B., Dancause N., He Y. Y., Cheney P. D. (2006). Electrical stimulation of cortex improves corticospinal tract tracing in rat spinal cord using manganese-enhanced MRI. J. Neurosci. Methods 156, 17–22. 10.1016/j.jneumeth.2006.02.001 - DOI - PubMed

Publication types

MeSH terms

LinkOut - more resources