. 2018 Apr 13:10:102.
doi: 10.3389/fnagi.2018.00102. eCollection 2018.

Brain Transcriptomic Analysis of Hereditary Cerebral Hemorrhage With Amyloidosis-Dutch Type

Affiliations

Brain Transcriptomic Analysis of Hereditary Cerebral Hemorrhage With Amyloidosis-Dutch Type

Laure Grand Moursel et al. Front Aging Neurosci. .

Abstract

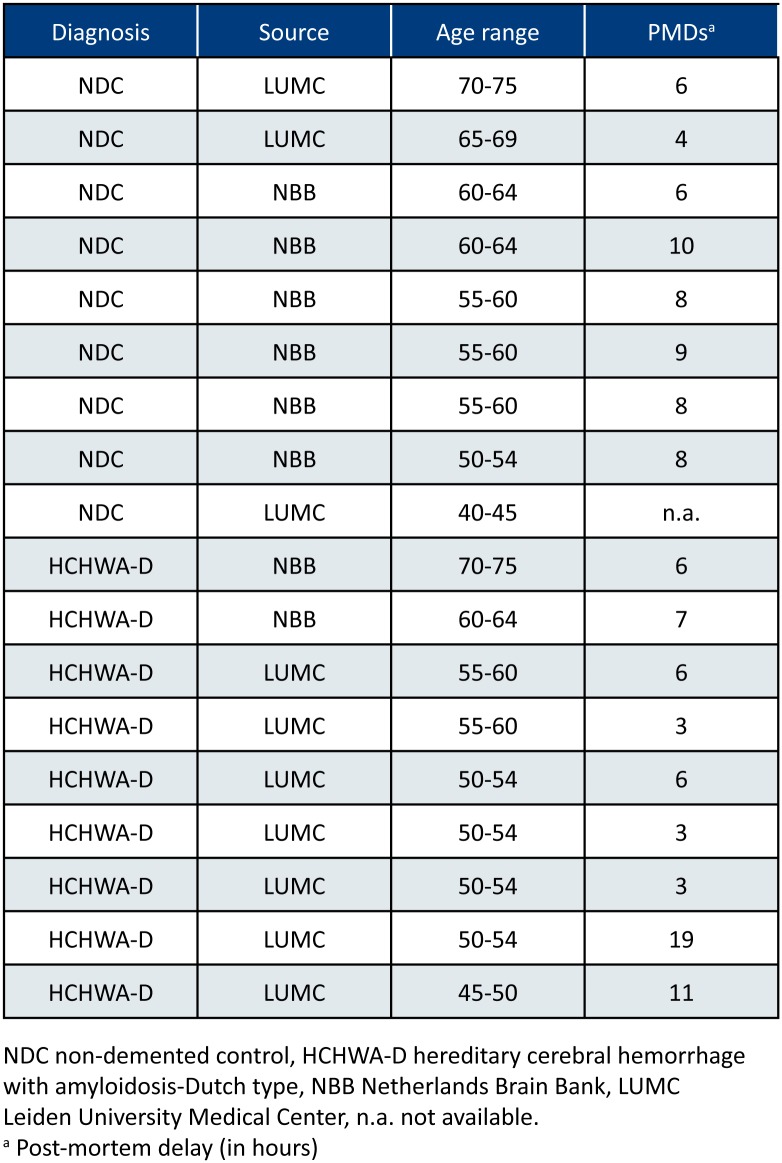
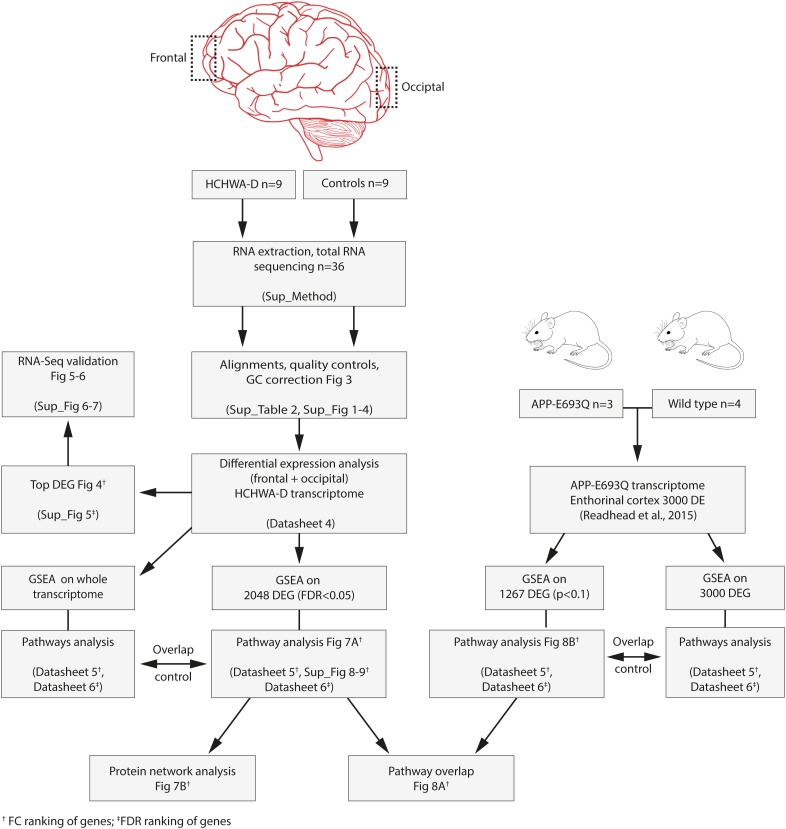
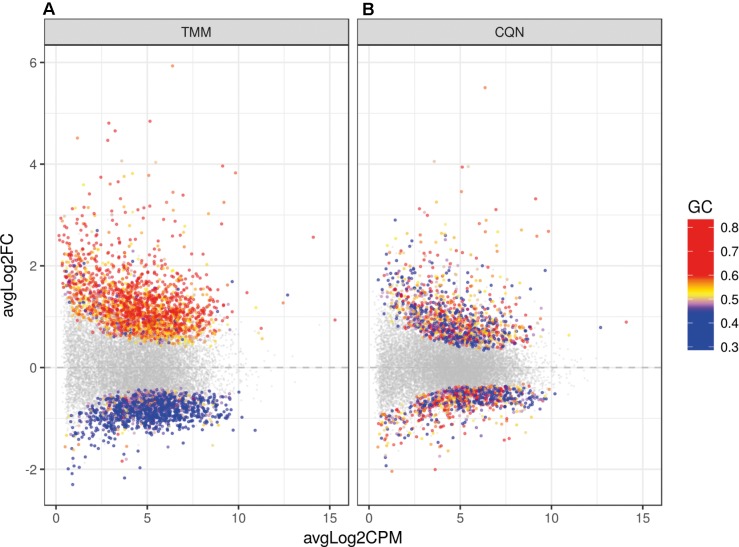
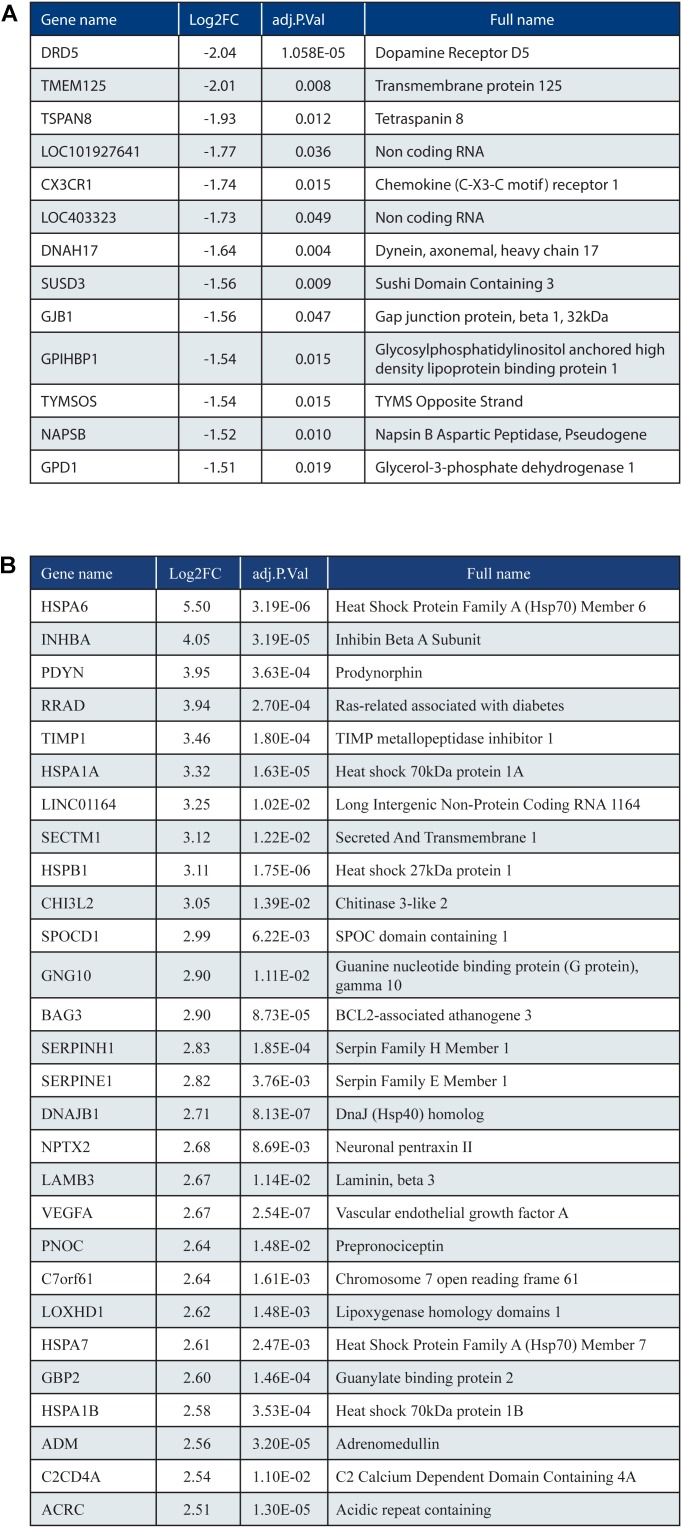
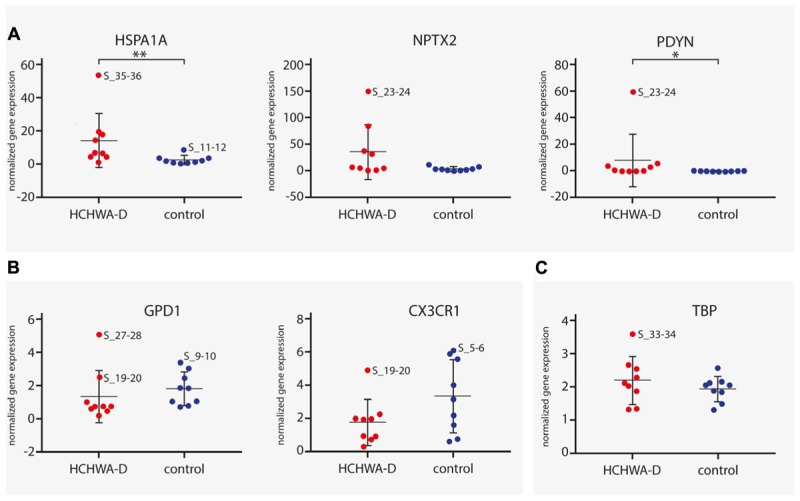
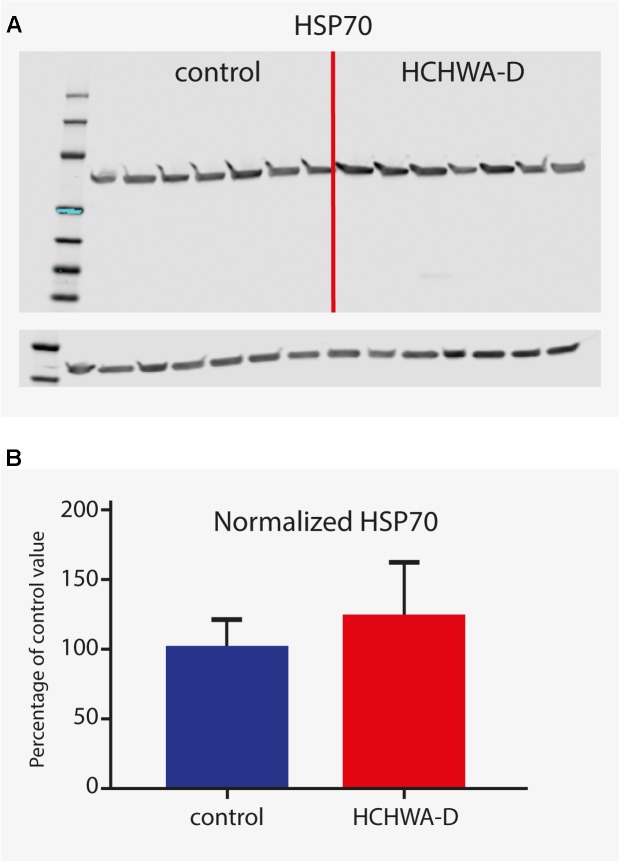
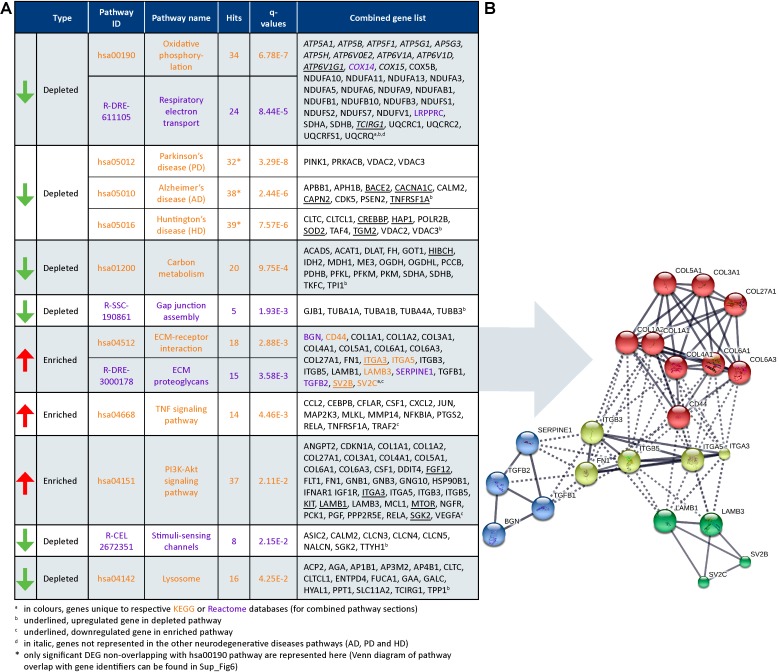
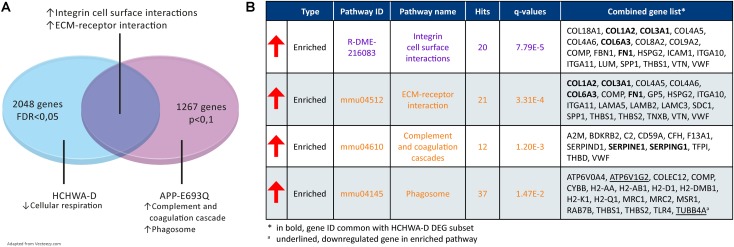
Hereditary cerebral hemorrhage with amyloidosis-Dutch type (HCHWA-D) is an early onset hereditary form of cerebral amyloid angiopathy (CAA) caused by a point mutation resulting in an amino acid change (NP_000475.1:p.Glu693Gln) in the amyloid precursor protein (APP). Post-mortem frontal and occipital cortical brain tissue from nine patients and nine age-related controls was used for RNA sequencing to identify biological pathways affected in HCHWA-D. Although previous studies indicated that pathology is more severe in the occipital lobe in HCHWA-D compared to the frontal lobe, the current study showed similar changes in gene expression in frontal and occipital cortex and the two brain regions were pooled for further analysis. Significantly altered pathways were analyzed using gene set enrichment analysis (GSEA) on 2036 significantly differentially expressed genes. Main pathways over-represented by down-regulated genes were related to cellular aerobic respiration (including ATP synthesis and carbon metabolism) indicating a mitochondrial dysfunction. Principal up-regulated pathways were extracellular matrix (ECM)-receptor interaction and ECM proteoglycans in relation with an increase in the transforming growth factor beta (TGFβ) signaling pathway. Comparison with the publicly available dataset from pre-symptomatic APP-E693Q transgenic mice identified overlap for the ECM-receptor interaction pathway, indicating that ECM modification is an early disease specific pathomechanism.

Keywords: E22Q amyloid β; E693Q mutation; RNA sequencing and transcriptome analysis; extracellular matrix remodeling; familial cerebral amyloid angiopathy; hereditary cerebral hemorrhage with amyloidosis-Dutch type; mitochondrial dysfunction.


Figures

FIGURE 1
FIGURE 1
Patient material overview. Controls without stroke were age-matched [mean age ± standard deviation (SD) HCHWA-D: 55.8 ± 7.1; NDC: 58.6 ± 8.4]; both gender were included in the two groups (%M, %F; HCHWA-D: 78, 22; NDC: 56, 44); and post-mortem delays (PMDs; in hours) were not significantly different (HCHWA-D: 7.1 ± 5.2; NDC: 7.2 ± 2.2). Frontal and occipital human post-mortem brain tissue was obtained from the Netherlands Brain Bank (NBB) and from our hospital (LUMC).
FIGURE 2
FIGURE 2
Flowchart of the study and associated files.
FIGURE 3
FIGURE 3
Dot plot of the differentially expressed genes (DEGs) in HCHWA-D samples compared to the control samples with log2 fold change (log2FC) vs. log2 counts per million (log2CPM) (A) without correction and (B) with CQN correction for GC bias. Significant DEGs in both panels are highlighted by colored dots; colors in legend indicate the GC-content.
FIGURE 4
FIGURE 4
(A) Top list of down-regulated genes based on fold change (ranking based on log2FC < –1.5; 13 out of 847 genes shown). (B) Top list of up-regulated genes (ranking based on log2FC > 2.5; 28 out of 1201 genes shown).
FIGURE 5
FIGURE 5
qPCR analysis of (A) three up-regulated genes (HSPA1A, NPTX2, and PDYN) and (B) two down-regulated genes (GPD1 and CX3CR1). Transcript levels of HCHWA-D samples were not following a normal distribution (data not shown). HSPA1A and PDYN were found significantly up-regulated (MW test, p = 0.006∗∗ and p = 0.040, respectively). For GPD1, significance was reached upon removal of the greatest outlier (t-test, p = 0.030; S_27-28 outlier identified with the ROUT method, Q = 1%; data not shown), no significant outliers found for CX3CR1. Transcript expression levels were normalized with two reference gene, n = 9. (C) TBP normalization control was not significantly different (t-test, p = 0.32). p < 0.05 and ∗∗p < 0.01. RNA-seq samples code are used to identify greatest outlier.
FIGURE 6
FIGURE 6
Western blot analysis of HSP70 (antibody detecting HSPA1A and HSPA1B). (A) Signals given by HSP70 antibody showing a band at 70 kDa (with β-actin loading control under main blot). (B) Signal intensity quantification (n = 7, β-actin normalized). Higher protein level in HCHWA-D occipital cortex compared to control occipital cortex was measured although not significantly different; p = 0.1888 with a two-tailed unpaired Student’s t-test.
FIGURE 7
FIGURE 7
Dysregulated pathways in HCHWA-D. (A) Significantly dysregulated pathways in HCHWA-D DEG subset and associated genes identifiers in GeneTrail2 v1.5 (with fold change input; ranked on statistical significance except for the combined HD, AD, and PD categories). Depleted pathways (green arrows) are over-represented by down-regulated genes and enriched pathways (red arrows) are over-represented by up-regulated genes. Text color codes distinguish pathways originating from KEGG (orange) or Reactome (purple) databases. (B) Schematic representation of known interactions between genes of the ECM-related pathways. Representation of high confidence interactions with MCL clustering in String interaction database (line thickness indicates the strength of data support).
FIGURE 8
FIGURE 8
Transcriptome comparison of HCHWA-D and APP-E963Q mouse model (entorhinal cortex; APP-E693Q vs. WT; Readhead et al., 2015). (A) Venn diagram depicting major dysregulations and overlap in enriched pathway. (B) Significantly dysregulated pathways in APP-E693Q DEG subset and associated genes identifiers in GeneTrail2 v1.5 (with fold change input; ranked on statistical significance). Text color codes distinguish pathways originating from KEGG (orange) or Reactome (purple) databases.

References

    1. Akiyama H., Tooyama I., Kawamata T., Ikeda K., McGeer P. L. (1993). Morphological diversities of CD44 positive astrocytes in the cerebral cortex of normal subjects and patients with Alzheimer’s disease. Brain Res. 632 249–259. 10.1016/0006-8993(93)91160-T - DOI - PubMed
    1. Albert-Weissenberger C., Mencl S., Schuhmann M. K., Salur I., Göb E., Langhauser F., et al. (2014). C1-Inhibitor protects from focal brain trauma in a cortical cryolesion mice model by reducing thrombo-inflammation. Front. Cell. Neurosci. 8:269. 10.3389/fncel.2014.00269 - DOI - PMC - PubMed
    1. Backes C., Keller A., Kuentzer J., Kneissl B., Comtesse N., Elnakady Y. A., et al. (2007). GeneTrail-advanced gene set enrichment analysis. Nucleic Acids Res. 35 186–192. 10.1093/nar/gkm323 - DOI - PMC - PubMed
    1. Costa R. O., Ferreiro E., Martins I., Santana I., Cardoso S. M., Oliveira C. R., et al. (2012). Amyloid beta-induced ER stress is enhanced under mitochondrial dysfunction conditions. Neurobiol. Aging 33 824.e5–824.e16. 10.1016/j.neurobiolaging.2011.04.011 - DOI - PubMed
    1. de Jager M., van der Wildt B., Schul E., Bol J. G., van Duinen S. G., Drukarch B., et al. (2013). Tissue transglutaminase colocalizes with extracellular matrix proteins in cerebral amyloid angiopathy. Neurobiol. Aging 34 1159–1169. 10.1016/j.neurobiolaging.2012.10.005 - DOI - PubMed

LinkOut - more resources