. 2018 Apr 13:9:661.
doi: 10.3389/fimmu.2018.00661. eCollection 2018.

A Serum Circulating miRNA Signature for Short-Term Risk of Progression to Active Tuberculosis Among Household Contacts

Collaborators, Affiliations

A Serum Circulating miRNA Signature for Short-Term Risk of Progression to Active Tuberculosis Among Household Contacts

Fergal J Duffy et al. Front Immunol. .

Abstract

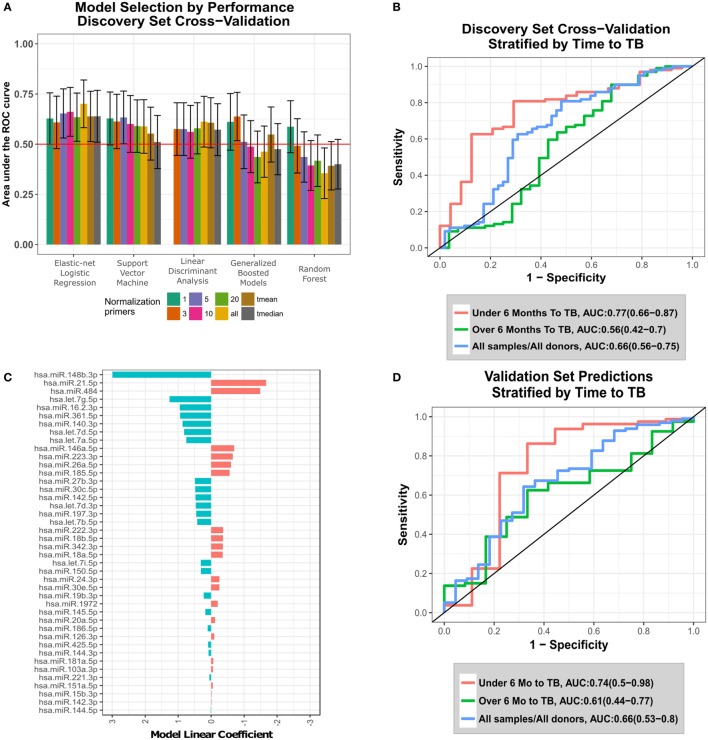
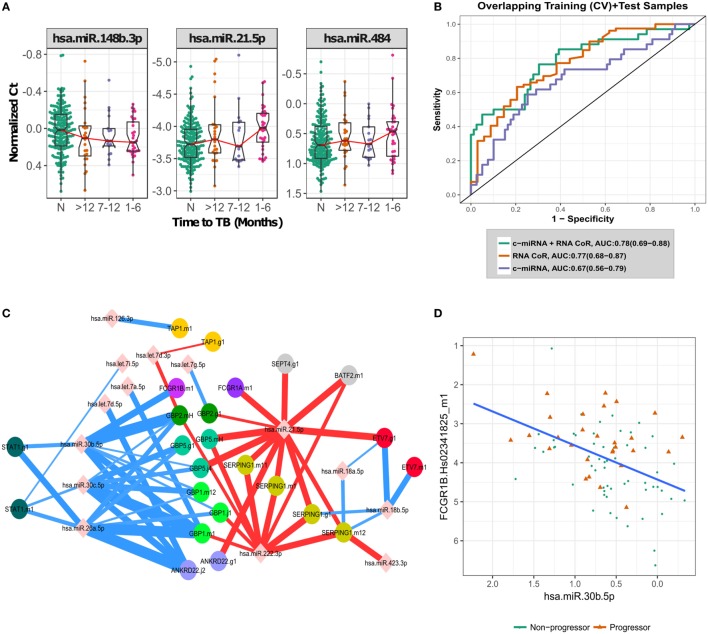
Biomarkers that predict who among recently Mycobacterium tuberculosis (MTB)-exposed individuals will progress to active tuberculosis are urgently needed. Intracellular microRNAs (miRNAs) regulate the host response to MTB and circulating miRNAs (c-miRNAs) have been developed as biomarkers for other diseases. We performed machine-learning analysis of c-miRNA measurements in the serum of adult household contacts (HHCs) of TB index cases from South Africa and Uganda and developed a c-miRNA-based signature of risk for progression to active TB. This c-miRNA-based signature significantly discriminated HHCs within 6 months of progression to active disease from HHCs that remained healthy in an independent test set [ROC area under the ROC curve (AUC) 0.74, progressors < 6 Mo to active TB and ROC AUC 0.66, up to 24 Mo to active TB], and complements the predictions of a previous cellular mRNA-based signature of TB risk.

Keywords: biomarker; correlate of risk; household contact; machine learning; microRNA; tuberculosis.


Figures

Figure 1
Figure 1
Development and validation of the circulating microRNA (c-miRNA) TB risk signature. (A) ROC area under the ROC curves (AUCs) from discovery set leave-one-donor-out-cross-validation (LOOCV) for five different machine-learning algorithms applied to data generated using eight different normalization approaches. Error bars represent the 95% confidence intervals. Normalization primers indicate the numbers of reference primers used to normalize the data (“all” = all 47 primers, and “tmean” and “tmedian” = 25% trimmed-mean or median of all primer expression, respectively). Horizontal red line indicates non-discrimination (AUC = 0.5). The machine-learning algorithms employed are indicated on the x-axis. (B) LOOCV ROC curves for the optimal algorithm (elastic-net logistic regression-all), stratified by the time between collection of the sample and TB diagnosis (time to TB). (C) Values of fitted linear coefficients for each c-miRNA in the final logistic regression signature. Red and blue indicate c-miRNAs detected at higher and lower levels in the serum of progressors compared with controls, respectively. (D) Validation set blind prediction ROC curves for the optimal TB risk signature with progressors stratified by time to TB as in (B).
Figure 2
Figure 2
Biological signal underlying the circulating microRNA (c-miRNA) signature. (A) Normalized PCR Ct values for the three most important c-miRNAs in the signature, with progressors stratified by time to active TB disease. “N” indicates non-progressor control samples. (B) ROC curves illustrating RNA-based correlate of risk (RNA-CoR) prediction score, c-miRNA (leave-one-donor-out-cross-validation + blind prediction scores for the 47 miRNA model) and combined score performance at classifying the shared set of discovery and validation samples. (C) Correlation network of c-miRNA and RNA-CoR gene PCR primers. c-miRNA—gene correlations calculated using Spearman’s rho with FDR < 0.05 are indicated by edges connecting miRNAs to genes. Edge thickness is proportional to significance of the correlation. Positive correlations are indicated in red, with negative correlations in blue. (D) Correlation between FCGR1B and miRNA hsa-miR-30b-5p, linear best fit line shown in blue.

References

    1. Houben RM, Dodd PJ. The global burden of latent tuberculosis infection: a re-estimation using mathematical modelling. PLoS Med (2016) 13:e1002152.10.1371/journal.pmed.1002152 - DOI - PMC - PubMed
    1. Marais BJ, Gie RP, Schaaf HS, Hesseling AC, Obihara CC, Starke JJ, et al. The natural history of childhood intra-thoracic tuberculosis: a critical review of literature from the pre-chemotherapy era. Int J Tuberc Lung Dis (2004) 8:392–402. - PubMed
    1. Pai M, Schito M. Tuberculosis diagnostics in 2015: landscape, priorities, needs, and prospects. J Infect Dis (2015) 211(Suppl 2):S21–8.10.1093/infdis/jiu803 - DOI - PMC - PubMed
    1. Zak DE, Penn-Nicholson A, Scriba TJ, Thompson E, Suliman S, Amon LM, et al. A blood RNA signature for tuberculosis disease risk: a prospective cohort study. Lancet (2016) 387:2312–22.10.1016/S0140-6736(15)01316-1 - DOI - PMC - PubMed
    1. Huang Y, Shen XJ, Zou Q, Wang SP, Tang SM, Zhang GZ. Biological functions of microRNAs: a review. J Physiol Biochem (2011) 67:129–39.10.1007/s13105-010-0050-6 - DOI - PubMed

Publication types