Sulforaphane suppresses oral cancer cell migration by regulating cathepsin S expression
- PMID: 29707130
- PMCID: PMC5915138
- DOI: 10.18632/oncotarget.24786
Sulforaphane suppresses oral cancer cell migration by regulating cathepsin S expression
Abstract
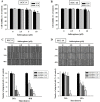
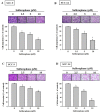
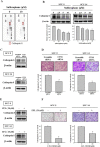
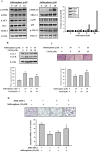
Sulforaphane has been demonstrated to exert numerous biological effects, such as neuroprotective, anti-inflammatory, and anticancer effects. However, the detailed effects of sulforaphane on human oral cancer cell migration and the underlying mechanisms remain unclear. In this study, we observed that sulforaphane attenuated SCC-9 and SCC-14 cell motility and invasiveness by reducing cathepsin S expression. Moreover, sulforaphane increased microtubule-associated protein 1 light chain 3 (LC3) conversion, and the knockdown of LC3 by siRNA increased cell migration ability. Regarding the mechanism, sulforaphane inhibited the cell motility of oral cancer cells through the extracellular signal-regulated kinase (ERK) pathway, which in turn reversed cell motility. In conclusion, sulforaphane suppress cathepsin S expression by inducing autophage through ERK signaling pathway. Thus, cathepsin S and LC3 may be new targets for oral cancer treatment.
Keywords: LC3; cathepsin S; migration; oral cancer; sulforaphane.
Conflict of interest statement
CONFLICTS OF INTEREST The authors declared no conflicts of interest.
Figures


Similar articles
-
Pyrocurzerenone suppresses human oral cancer cell metastasis by inhibiting the expression of ERK1/2 and cathepsin S proteins.J Cell Mol Med. 2024 Aug;28(16):e70015. doi: 10.1111/jcmm.70015. J Cell Mol Med. 2024. PMID: 39159189 Free PMC article.
-
Sulforaphane metabolites inhibit migration and invasion via microtubule-mediated Claudins dysfunction or inhibition of autolysosome formation in human non-small cell lung cancer cells.Cell Death Dis. 2019 Mar 15;10(4):259. doi: 10.1038/s41419-019-1489-1. Cell Death Dis. 2019. PMID: 30874545 Free PMC article.
-
Narciclasine suppresses oral cancer metastasis by modulating cathepsin B and extracellular signal-related kinase pathways.Biomed Pharmacother. 2023 Feb;158:114159. doi: 10.1016/j.biopha.2022.114159. Epub 2022 Dec 26. Biomed Pharmacother. 2023. PMID: 36577331
-
Sulforaphane inhibits phorbol ester-stimulated IKK-NF-κB signaling and COX-2 expression in human mammary epithelial cells by targeting NF-κB activating kinase and ERK.Cancer Lett. 2014 Aug 28;351(1):41-9. doi: 10.1016/j.canlet.2014.03.037. Epub 2014 Apr 18. Cancer Lett. 2014. PMID: 24747121
-
MicroRNAs as novel targets of sulforaphane in cancer therapy: The beginning of a new tale?Phytother Res. 2020 Apr;34(4):721-728. doi: 10.1002/ptr.6572. Epub 2020 Jan 23. Phytother Res. 2020. PMID: 31972874 Review.
Cited by
-
Sulforaphane from Cruciferous Vegetables: Recent Advances to Improve Glioblastoma Treatment.Nutrients. 2018 Nov 14;10(11):1755. doi: 10.3390/nu10111755. Nutrients. 2018. PMID: 30441761 Free PMC article. Review.
-
Antimetastatic Effects of Sesamin on Human Head and Neck Squamous Cell Carcinoma through Regulation of Matrix Metalloproteinase-2.Molecules. 2020 May 10;25(9):2248. doi: 10.3390/molecules25092248. Molecules. 2020. PMID: 32397656 Free PMC article.
-
Pyrocurzerenone suppresses human oral cancer cell metastasis by inhibiting the expression of ERK1/2 and cathepsin S proteins.J Cell Mol Med. 2024 Aug;28(16):e70015. doi: 10.1111/jcmm.70015. J Cell Mol Med. 2024. PMID: 39159189 Free PMC article.
-
Sulforaphane Wrapped in Self-Assembled Nanomicelle Enhances the Effect of Sonodynamic Therapy on Glioma.Pharmaceutics. 2024 Dec 30;17(1):34. doi: 10.3390/pharmaceutics17010034. Pharmaceutics. 2024. PMID: 39861683 Free PMC article.
-
Synergistic Inhibition of Breast Carcinoma Cell Proliferation by Quercetin and Sulforaphane via Activation of the ERK/MAPK Pathway.Cell Biochem Biophys. 2025 Jun;83(2):2533-2546. doi: 10.1007/s12013-024-01662-6. Epub 2025 Jan 6. Cell Biochem Biophys. 2025. PMID: 39760839
References
-
- Santosh AB, Jones T, Harvey J. A review on oral cancer biomarkers: Understanding the past and learning from the present. J Cancer Res Ther. 2016;12:486–92. https://doi.org/10.4103/0973-1482.176414. - DOI - PubMed
-
- Cairns RA, Khokha R, Hill RP. Molecular mechanisms of tumor invasion and metastasis: an integrated view. Curr Mol Med. 2003;3:659–71. - PubMed
-
- Su SC, Hsieh MJ, Yang WE, Chung WH, Reiter RJ, Yang SF. Cancer metastasis: Mechanisms of inhibition by melatonin. J Pineal Res. 2017;62 https://doi.org/10.1111/jpi.12370. - DOI - PubMed
-
- Petanceska S, Canoll P, Devi LA. Expression of rat cathepsin S in phagocytic cells. J Biol Chem. 1996;271:4403–9. - PubMed
-
- Gocheva V, Zeng W, Ke D, Klimstra D, Reinheckel T, Peters C, Hanahan D, Joyce JA. Distinct roles for cysteine cathepsin genes in multistage tumorigenesis. Genes Dev. 2006;20:543–56. https://doi.org/10.1101/gad.1407406. - DOI - PMC - PubMed
LinkOut - more resources
Full Text Sources
Other Literature Sources
Research Materials
Miscellaneous

