. 2018 Apr 19:4:16.
doi: 10.1038/s41540-018-0052-5. eCollection 2018.

Detecting phenotype-driven transitions in regulatory network structure

Affiliations

Detecting phenotype-driven transitions in regulatory network structure

Megha Padi et al. NPJ Syst Biol Appl. .

Abstract

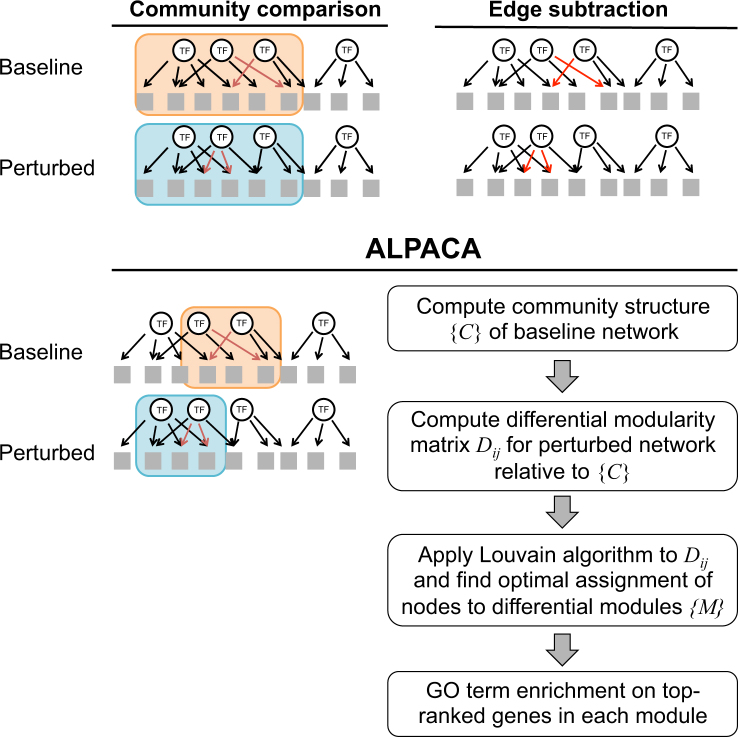
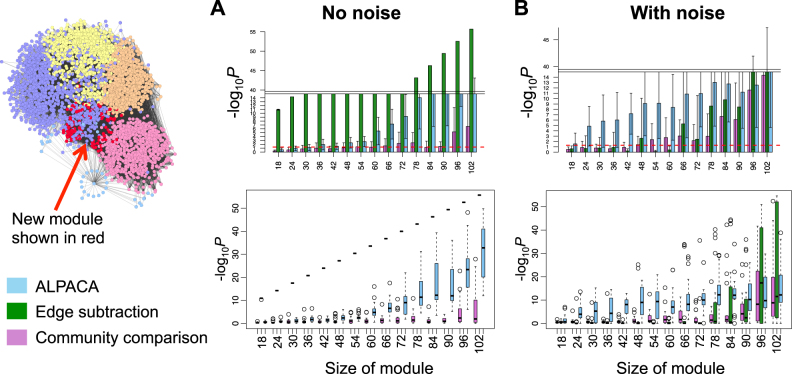
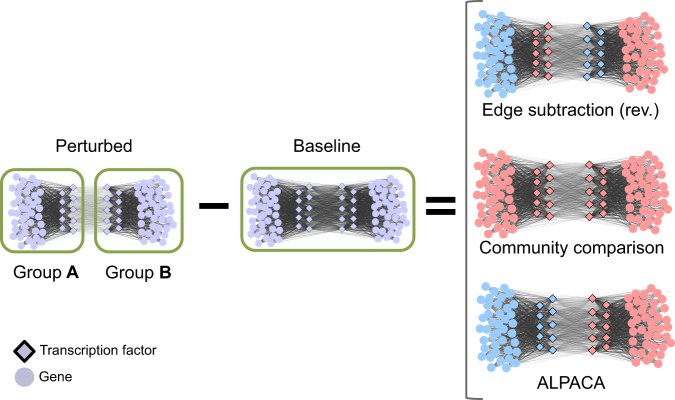
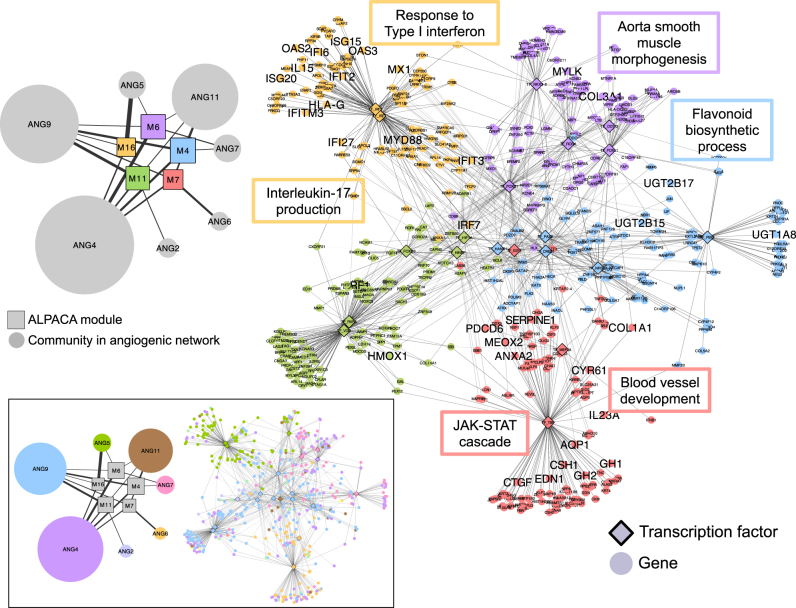
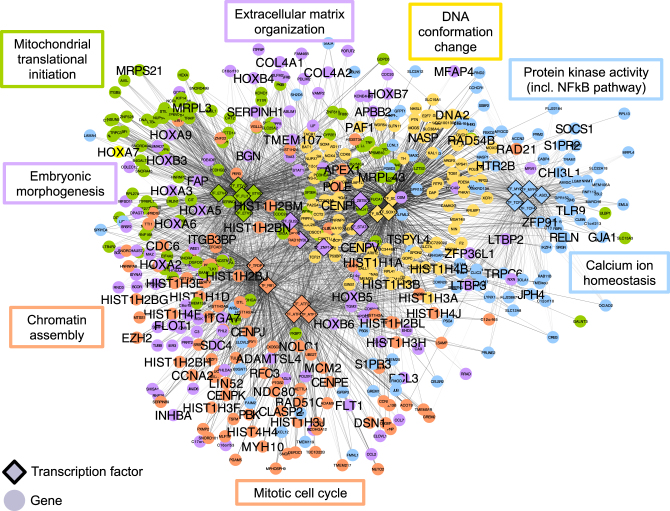
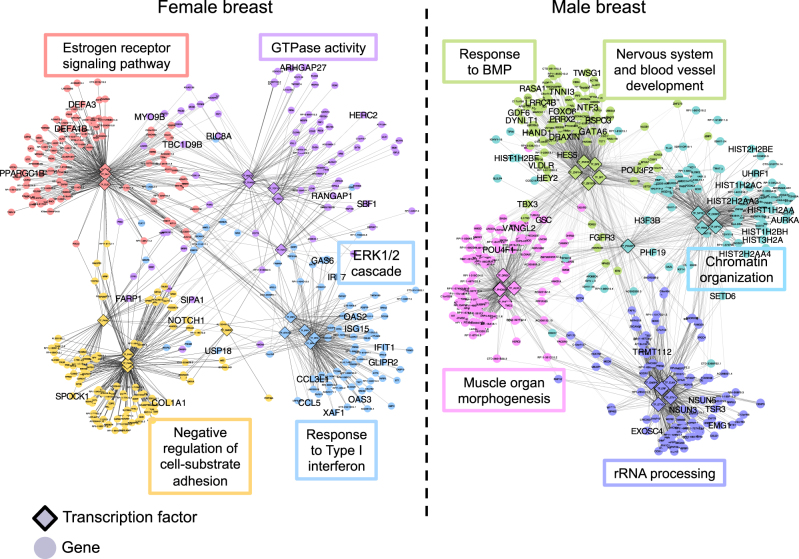
Complex traits and diseases like human height or cancer are often not caused by a single mutation or genetic variant, but instead arise from functional changes in the underlying molecular network. Biological networks are known to be highly modular and contain dense "communities" of genes that carry out cellular processes, but these structures change between tissues, during development, and in disease. While many methods exist for inferring networks and analyzing their topologies separately, there is a lack of robust methods for quantifying differences in network structure. Here, we describe ALPACA (ALtered Partitions Across Community Architectures), a method for comparing two genome-scale networks derived from different phenotypic states to identify condition-specific modules. In simulations, ALPACA leads to more nuanced, sensitive, and robust module discovery than currently available network comparison methods. As an application, we use ALPACA to compare transcriptional networks in three contexts: angiogenic and non-angiogenic subtypes of ovarian cancer, human fibroblasts expressing transforming viral oncogenes, and sexual dimorphism in human breast tissue. In each case, ALPACA identifies modules enriched for processes relevant to the phenotype. For example, modules specific to angiogenic ovarian tumors are enriched for genes associated with blood vessel development, and modules found in female breast tissue are enriched for genes involved in estrogen receptor and ERK signaling. The functional relevance of these new modules suggests that not only can ALPACA identify structural changes in complex networks, but also that these changes may be relevant for characterizing biological phenotypes.


Conflict of interest statement

The authors declare no competing financial interests.

Figures

Fig. 1
Fig. 1
Methods to compare networks and find changes in modular structure. “Community comparison” identifies communities separately in each network and looks for nodes that change their community membership. “Edge subtraction” finds communities by subtracting the networks and finding communities in the resulting differential edges (red arrows). ALPACA looks for groups of genes that are more interconnected in the perturbed network than expected given the community structure of the baseline network. Flowchart shows the major steps in the implementation of ALPACA
Fig. 2
Fig. 2
Performance of three methods on simulated networks with added module. Network at left visualizes the regulatory network derived from normal human fibroblasts, with purple, yellow, orange, pink, and blue denoting the pre-existing community structure, and red nodes depicting the synthetically added module. Bar graphs show performance of each method—ALPACA, edge subtraction or community comparison—on network simulations with (a) or without (b) resampling of edges among the pre-existing communities. P-values were computed using a one-sided Wilcoxon test. Bar graphs show mean of −log10P over 20 network simulations, and error bars depict the corresponding standard deviation. Boxplots represent same data as the bar plots. Boxplot elements are defined as follows: center line, median; box limits, upper and lower quartiles; whiskers, 1.5× interquartile range; points, outliers. Note that the color of the boxplots for the edge subtraction method in a is not visible because the distribution is very narrow
Fig. 3
Fig. 3
Performance of three methods on perturbations that decrease edge density. Left-hand side shows a network transition involving a decrease in edge weights between nodes in groups A and B. All other edges remain the same. Right-hand side shows the results of three methods when comparing these two networks. Each method identified up to two differential modules, which are distinguished by their light blue and light pink colors in each case. Note that the “edge subtraction” method needs to be applied in the reverse manner, comparing the baseline network against the perturbed network, in order to have positive differential edge weights
Fig. 4
Fig. 4
ALPACA modules associated with angiogenic ovarian tumors. Right-hand side shows five of the modules, with nodes colored by their membership. Edge opacity is proportional to its contribution to the differential modularity. Network is annotated with representative enriched GO terms with Padj < 0.05, and the genes annotated by the shown GO terms are labeled in larger font. Left-hand side shows the relationship between the ALPACA modules (denoted by M) and the community structure of the angiogenic network (denoted by ANG). Edge thickness depicts the fraction of genes in that differential module that are present in a particular angiogenic network community. The size of each node is proportional to the number of genes in that module or community. Bottom inset: Same networks as above, but colored by community membership in the angiogenic network rather than by membership in the ALPACA modules
Fig. 5
Fig. 5
ALPACA modules associated with transforming viral oncogenes. Network shows five modules, with nodes colored by membership in differential modules. Edge opacity is proportional to its contribution to the differential modularity. Network is annotated with representative enriched GO terms with Padj < 0.05. Genes annotated by the shown GO terms are labeled in large font
Fig. 6
Fig. 6
Sexually dimorphic ALPACA modules in human breast tissue. Networks show four modules specific to either female (left-hand side) or male (right-hand side) breast tissue. Nodes are colored by membership in differential modules. Edge opacity is proportional to its contribution to the differential modularity. Networks are annotated with representative enriched GO terms with Padj < 0.05. Genes annotated by the shown GO terms are labeled in large font

References

    1. Padi M, Quackenbush J. Integrating transcriptional and protein interaction networks to prioritize condition-specific master regulators. BMC Syst. Biol. 2015;9:80. doi: 10.1186/s12918-015-0228-1. - DOI - PMC - PubMed
    1. Giaever G, et al. Functional profiling of the Saccharomyces cerevisiae genome. Nature. 2002;418:387–391. doi: 10.1038/nature00935. - DOI - PubMed
    1. Locke AE, et al. Genetic studies of body mass index yield new insights for obesity biology. Nature. 2015;518:197–206. doi: 10.1038/nature14177. - DOI - PMC - PubMed
    1. Wood AR, et al. Defining the role of common variation in the genomic and biological architecture of adult human height. Nat. Genet. 2014;46:1173–1186. doi: 10.1038/ng.3097. - DOI - PMC - PubMed
    1. Fuchsberger C, et al. The genetic architecture of type 2 diabetes. Nature. 2016;536:41–47. doi: 10.1038/nature18642. - DOI - PMC - PubMed