. 2018 Jan 11:9:49-61.
doi: 10.1016/j.pacs.2017.12.001. eCollection 2018 Mar.

Towards optimized naphthalocyanines as sonochromes for photoacoustic imaging in vivo

Affiliations

Towards optimized naphthalocyanines as sonochromes for photoacoustic imaging in vivo

Mitchell J Duffy et al. Photoacoustics. .

Abstract

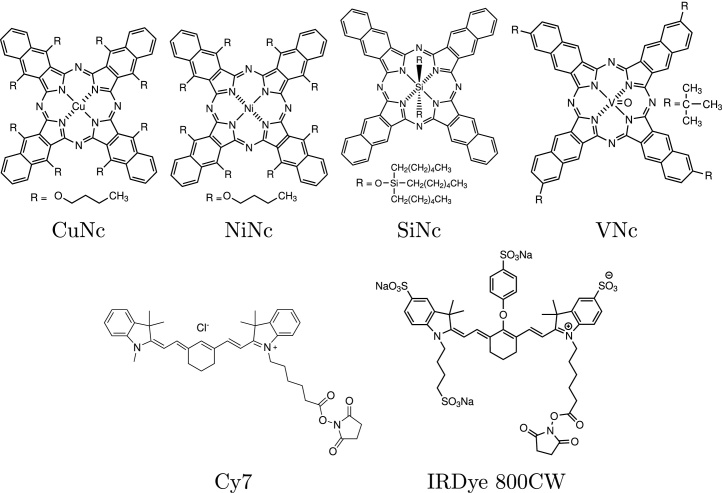
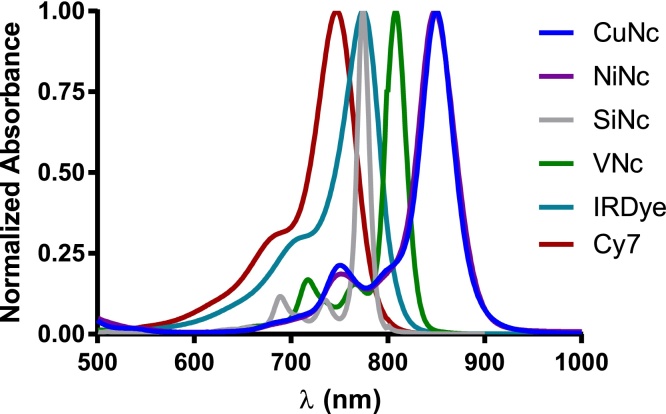
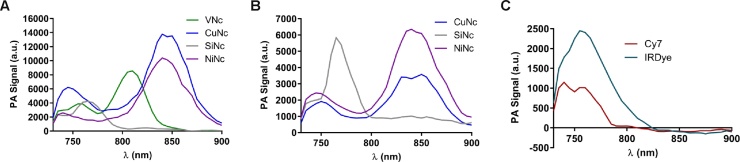
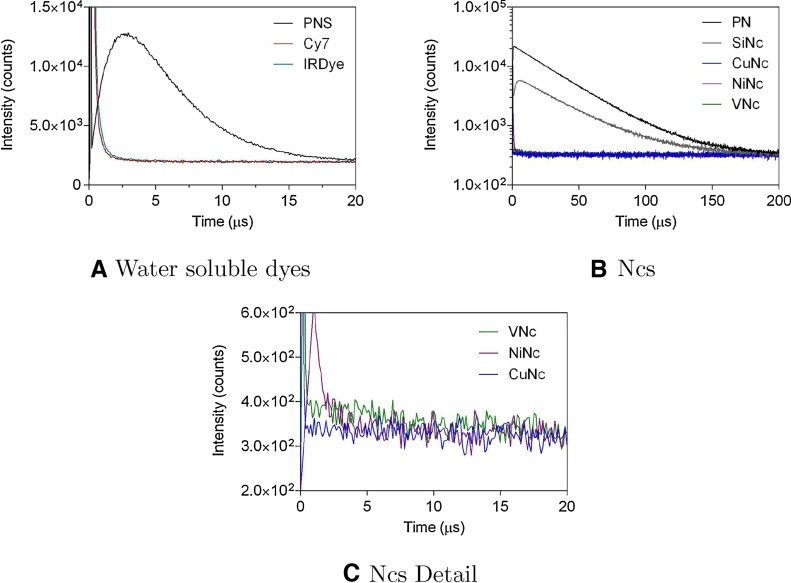
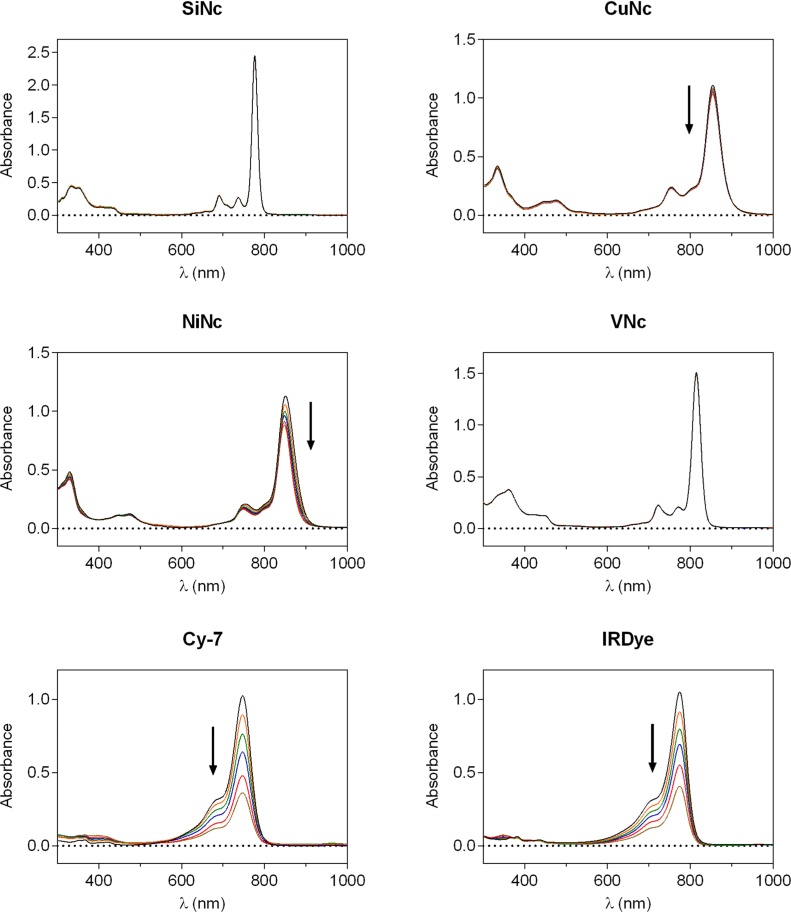
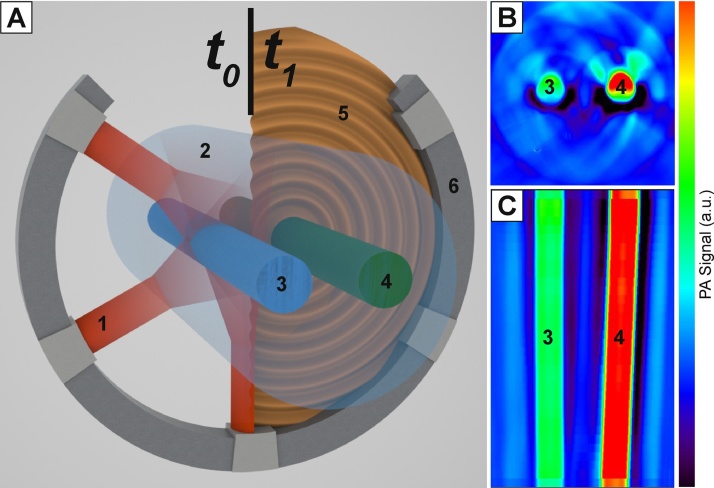
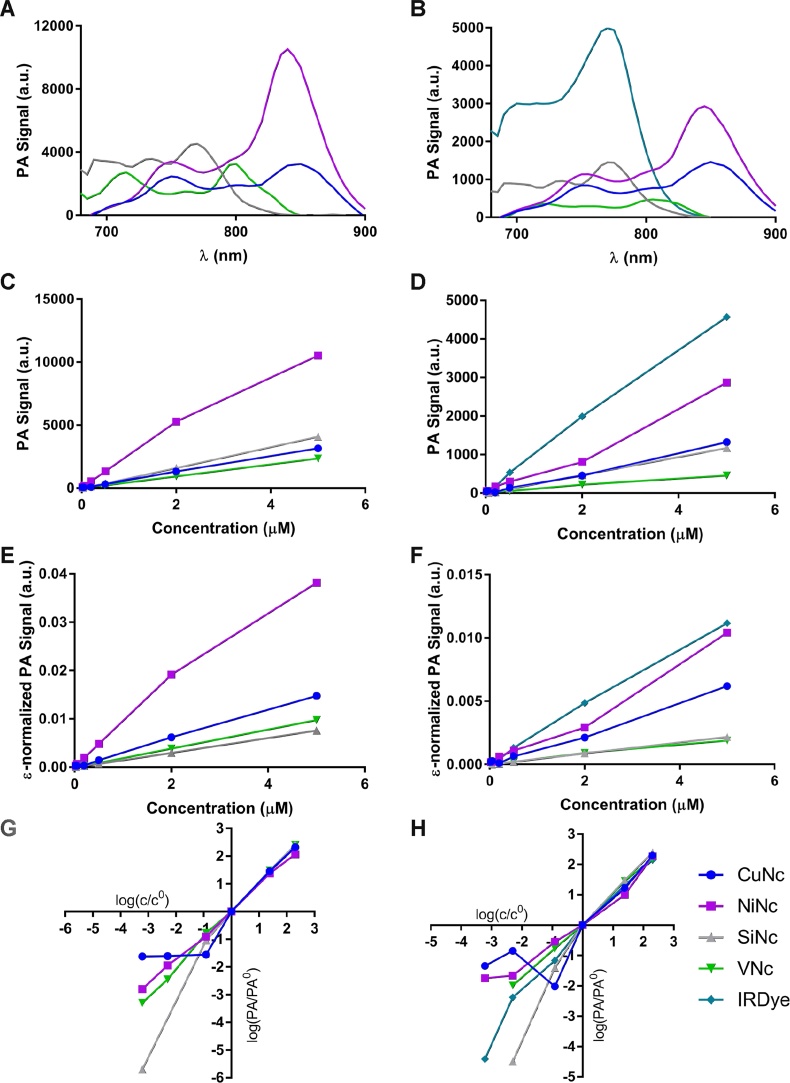
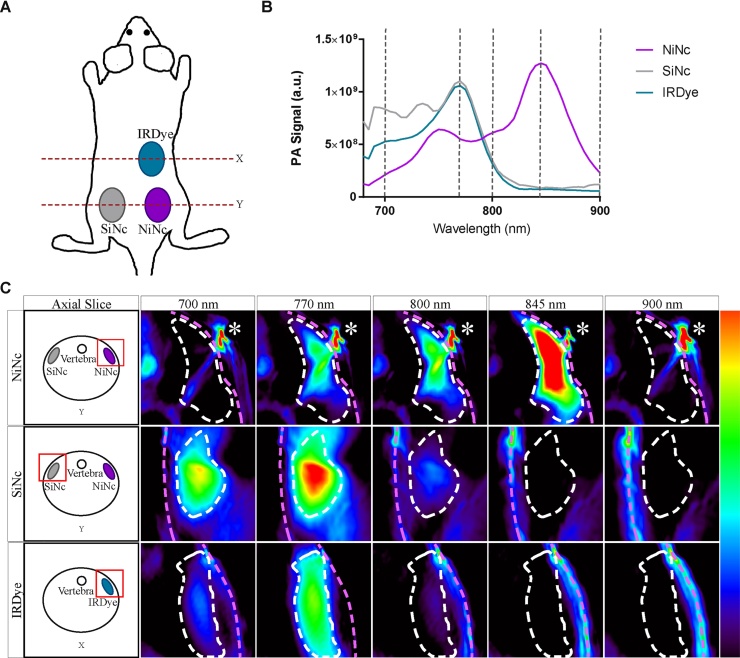
In this paper we establish a methodology to predict photoacoustic imaging capabilities from the structure of absorber molecules (sonochromes). The comparative in vitro and in vivo screening of naphthalocyanines and cyanine dyes has shown a substitution pattern dependent shift in photoacoustic excitation wavelength, with distal substitution producing the preferred maximum around 800 nm. Central ion change showed variable production of photoacoustic signals, as well as singlet oxygen photoproduction and fluorescence with the optimum for photoacoustic imaging being nickel(II). Our approach paves the way for the design, evaluation and realization of optimized sonochromes as photoacoustic contrast agents.

Keywords: Naphthalocyanines; Spectroscopy.


Figures

Fig. 1
Fig. 1
Photoacoustic dyes used in this study.
Fig. 2
Fig. 2
Normalized absorption spectra of the dyes investigated in this study at 5 μM.
Fig. 3
Fig. 3
Experimental setup for photoacoustic spectroscopy (PAS).
Fig. 4
Fig. 4
Photoacoustic spectra of Ncs (5 μM) in toluene (A) and in Cremophor (B), and of cyanine dyes (5 μM) in water (C). The spectra are corrected for solvent background and laser intensity. Measurements were carried out with the setup described in Fig. 3.
Fig. 5
Fig. 5
Phosphorescence decay curves at 1275 nm for (A) PNS (reference) and water soluble cyanine dyes and (B) PN (reference) and Nc dyes. (C) Shows a detailed depiction of the first 20 μs of b.
Fig. 6
Fig. 6
Photobleaching of probes exposed to NIR irradiation (λ > 715 nm) by monitoring the absorption spectra as a function of time (t = 0, 10, 20, 30, 45, 60 min).
Fig. 7
Fig. 7
(A) MSOT system depicted schematically. At time t0, NIR laser light (1) is emitted from 5 ports and strikes the agarose phantom (2) where it diffuses and scatters, reaching two straws holding the control medium (3) and the sample (4). At time t1, photoacoustic soundwaves (5) are emitted and detected as they strike the detector ring (6). (B) An axial slice of the cylindrical phantom. The control medium (3), in this case toluene, and the sample (4), in this case 5 μM NiNc, are shown. (C) A longitudinal slice of the same agarose phantom during the same measurement.
Fig. 8
Fig. 8
Photoacoustic spectra and concentration dependency graphs from reconstructed MSOT photoacoustic images in toluene (A, C, E, G), Ncs in Cremophor and IRDye in water (B, D, F, H). Spectra at a concentration of 5 μM (A, B). C and D are the processed PA signal as a function of concentration. E and F are the photoacoustic intensities divided by molar absorption coefficients (ϵ) of the corresponding dye in toluene. G and H are double logarithmic plots of the normalized photoacoustic signal as a function of normalized concentration where the normalization was the signal and concentration at the lowest verifiable measurement (0.5 μM) respectively. Measurements were carried out on the MSOT system as seen in Fig. 7, which automatically corrects for excitation laser intensity. All calculations were conducted at the excitation maximum of each dye respectively. The signal processing pipeline is depicted in Fig. 10.
Fig. 9
Fig. 9
(A) Overview of a mouse with 3 subcutaneous Bio-Gel pellets, each containing a photoacoustic probe. X and Y indicate 2 axial cuts shown in C. (B) Average spectra (n = 3) retrieved from volumes-of-interest drawn over the pellets. Grey lines indicate wavelengths of the images in C. (C) PA images of pellets from each probe at selected wavelengths. The white dashed line outlines the pellet while the pink dashed line indicates the skin. The asterisk indicates a bubble artifact. Axial slice diagrams are provided for orientation.
Fig. 10
Fig. 10
Schematic representation of the data processing pipeline used in the analysis of MSOT PA spectroscopy data (Fig. 8). Photoacoustic images of the samples were collected in triplicate at different concentrations of the dye, using a phantom setup in the MSOT system as shown in Fig. 7. For each solute–solvent pair at a particular concentration, images of the substance and solvent background were collected simultaneously and the images were analyzed to extract the raw spectra. After solvent background (BG) subtraction the resulting spectra were zeroed (zeroing) using the signal at a wavelength where the substances were known not to absorb. The three resulting spectra were averaged and the photoacoustic signal maximum was extracted. This process was conducted for multiple concentrations and the maxima of the resulting averages were then plotted as a function of concentration.

References

    1. Wang L.V., Hu S. Photoacoustic tomography: in vivo imaging from organelles to organs. Science (80-). 2012;335:1458–1462. - PMC - PubMed
    1. Zackrisson S., Van De Ven S.M.W.Y., Gambhir S.S. 2014. Light In and Sound Out: Emerging Translational Strategies for Photoacoustic Imaging. - PMC - PubMed
    1. Taruttis A., Timmermans A.C., Wouters P.C., Kacprowicz M., van Dam G.M., Ntziachristos V. Optoacoustic imaging of human vasculature: feasibility by using a handheld probe. Radiology. 2016;281:256–263. - PubMed
    1. Hoelen C.G.A., de Mul F.F.M., Pongers R., Dekker A. Three-dimensional photoacoustic imaging of blood vessels in tissue. Opt. Lett. 1998;23:648. - PubMed
    1. Wang X., Pang Y., Ku G., Xie X., Stoica G., Wang L.V. Noninvasive laser-induced photoacoustic tomography for structural and functional in vivo imaging of the brain. Nat. Biotechnol. 2003;21:803–806. - PubMed