

Precision of manual two-dimensional segmentations of lung and liver metastases and its impact on tumour response assessment using RECIST 1.1
- PMID: 29708185
- PMCID: PMC5909353
- DOI: 10.1186/s41747-017-0015-4
Precision of manual two-dimensional segmentations of lung and liver metastases and its impact on tumour response assessment using RECIST 1.1
Abstract
Background: Response evaluation criteria in solid tumours (RECIST) has significant limitations in terms of variability and reproducibility, which may not be independent. The aim of the study was to evaluate the precision of manual bi-dimensional segmentation of lung, liver metastases, and to quantify the uncertainty in tumour response assessment.
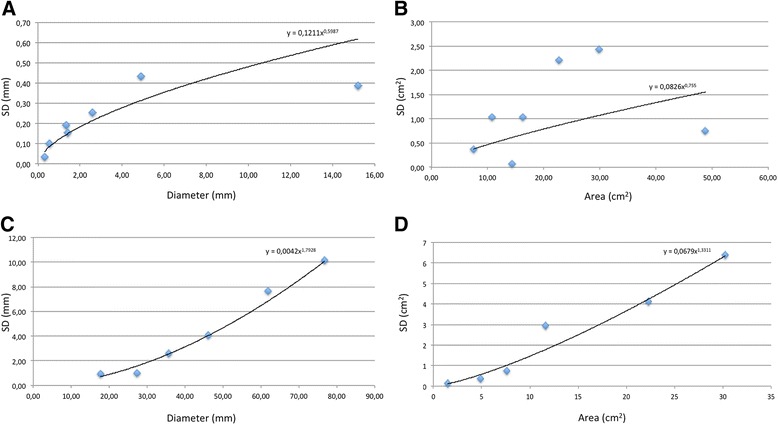
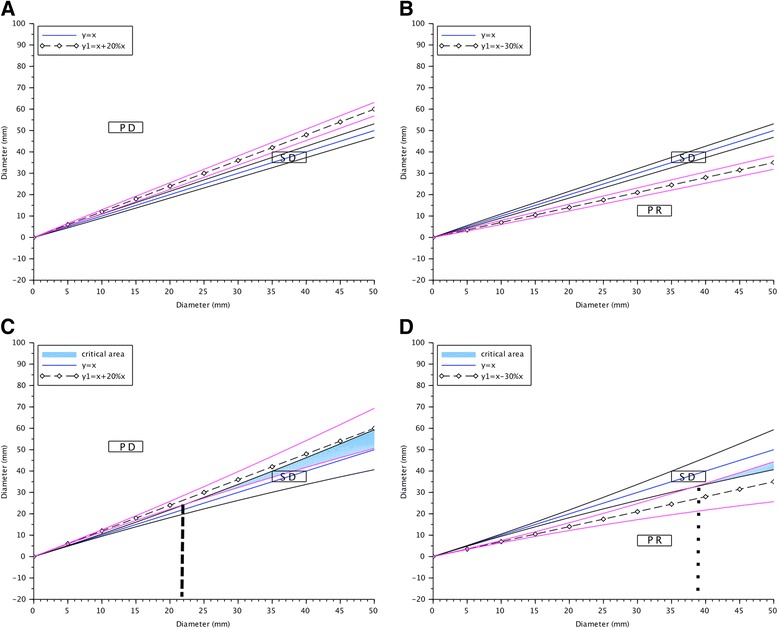
Methods: A total of 520 segmentations of metastases from six livers and seven lungs were independently performed by ten physicians and ten scientists on CT images, reflecting the variability encountered in clinical practice. Operators manually contoured the tumours, firstly independently according to the RECIST and secondly on a preselected slice. Diameters and areas were extracted from the segmentations. Mean standard deviations were used to build regression models and 95% confidence intervals (95% CI) were calculated for each tumour size and for limits of progressive disease (PD) and partial response (PR) derived from RECIST 1.1.
Results: Thirteen aberrant segmentations (2.5%) were observed without significant differences between the physicians and scientists; only the mean area of liver tumours (p = 0.034) and mean diameter of lung tumours (p = 0.021) differed significantly. No difference was observed between the methods. Inter-observer agreement was excellent (intra-class correlation >0.90) for all variables. In liver, overlaps of the 95% CI with the 95% CI of limits of PD or PR were observed for diameters above 22.7 and 37.9 mm, respectively. An overlap of 95% CIs was systematically observed for area. No overlaps were observed in lung.
Conclusions: Although the experience of readers might not affect the precision of segmentation in lung and liver, the results of manual segmentation performed for tumour response assessment remain uncertain for large liver metastases.
Keywords: Computed tomography; Liver; Lung; Metasatses; Response evaluation criteria in solid tumours (RECIST); Segmentation.
Conflict of interest statement
Competing interestsThe authors declare that they have no competing interests. Springer Nature remains neutral with regard to jurisdictional claims in published maps and institutional affiliations.
Figures


Similar articles
-
Reliability of Automated RECIST 1.1 and Volumetric RECIST Target Lesion Response Evaluation in Follow-Up CT-A Multi-Center, Multi-Observer Reading Study.Cancers (Basel). 2024 Nov 29;16(23):4009. doi: 10.3390/cancers16234009. Cancers (Basel). 2024. PMID: 39682195 Free PMC article.
-
Lung, liver and lymph node metastases in follow-up MSCT: comprehensive volumetric assessment of lesion size changes.Rofo. 2012 Sep;184(9):820-8. doi: 10.1055/s-0032-1312860. Epub 2012 Aug 7. Rofo. 2012. PMID: 22872601
-
Intra- and inter-observer variability in measurement of target lesions: implication on response evaluation according to RECIST 1.1.Radiol Oncol. 2012 Mar;46(1):8-18. doi: 10.2478/v10019-012-0009-z. Epub 2012 Jan 2. Radiol Oncol. 2012. PMID: 22933974 Free PMC article.
-
Observer variability in RECIST-based tumour burden measurements: a meta-analysis.Eur J Cancer. 2016 Jan;53:5-15. doi: 10.1016/j.ejca.2015.10.014. Epub 2015 Dec 10. Eur J Cancer. 2016. PMID: 26687017 Review.
-
RECIST revisited: a review of validation studies on tumour assessment.Eur J Cancer. 2006 May;42(8):1031-9. doi: 10.1016/j.ejca.2006.01.026. Epub 2006 Apr 17. Eur J Cancer. 2006. PMID: 16616487 Review.
Cited by
-
Transformer based Generative Adversarial Network for Liver Segmentation.Proc Int Conf Image Anal Process. 2022 May;13374:340-347. doi: 10.1007/978-3-031-13324-4_29. Epub 2022 Aug 4. Proc Int Conf Image Anal Process. 2022. PMID: 36745150 Free PMC article.
-
Automatic liver tumor segmentation in CT with fully convolutional neural networks and object-based postprocessing.Sci Rep. 2018 Oct 19;8(1):15497. doi: 10.1038/s41598-018-33860-7. Sci Rep. 2018. PMID: 30341319 Free PMC article.
-
Radiologists and Clinical Trials: Part 1 The Truth About Reader Disagreements.Ther Innov Regul Sci. 2021 Nov;55(6):1111-1121. doi: 10.1007/s43441-021-00316-6. Epub 2021 Jul 6. Ther Innov Regul Sci. 2021. PMID: 34228319 Free PMC article. Review.
-
Deep learning and level set approach for liver and tumor segmentation from CT scans.J Appl Clin Med Phys. 2020 Oct;21(10):200-209. doi: 10.1002/acm2.13003. Epub 2020 Aug 10. J Appl Clin Med Phys. 2020. PMID: 33113290 Free PMC article.
-
Retrospective comparison of approaches to evaluating inter-observer variability in CT tumour measurements in an academic health centre.BMJ Open. 2020 Nov 14;10(11):e040096. doi: 10.1136/bmjopen-2020-040096. BMJ Open. 2020. PMID: 33191265 Free PMC article.
References
-
- Therasse P, Arbuck SG, Eisenhauer EA et al (2000) New Guidelines to Evaluate the Response to Treatment in Solid Tumors. JNCI J Natl Cancer Inst 92:205–216. - PubMed
-
- Eisenhauer EA, Therasse P, Bogaerts J et al (2009) New response evaluation criteria in solid tumours: revised RECIST guideline (version 1.1). Eur J Cancer 45:228–247. - PubMed
-
- Bogaerts J, Ford R, Sargent D et al (2009) Individual patient data analysis to assess modifications to the RECIST criteria. Eur J Cancer 45:248–260. - PubMed
LinkOut - more resources
Full Text Sources
Other Literature Sources
Research Materials