. 2017;1(1):25.
doi: 10.1186/s41747-017-0030-5. Epub 2017 Dec 22.

Simultaneous dual-contrast multi-phase liver imaging using spectral photon-counting computed tomography: a proof-of-concept study

Affiliations

Simultaneous dual-contrast multi-phase liver imaging using spectral photon-counting computed tomography: a proof-of-concept study

Daniela Muenzel et al. Eur Radiol Exp. 2017.

Abstract

Background: To assess the feasibility of dual-contrast spectral photon-counting computed tomography (SPCCT) for liver imaging.

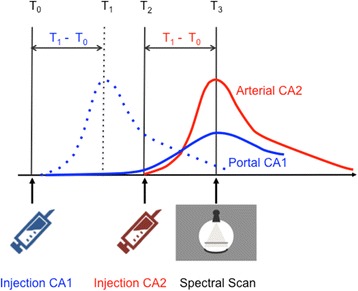
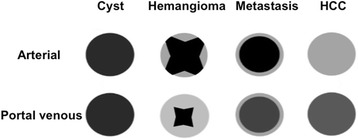
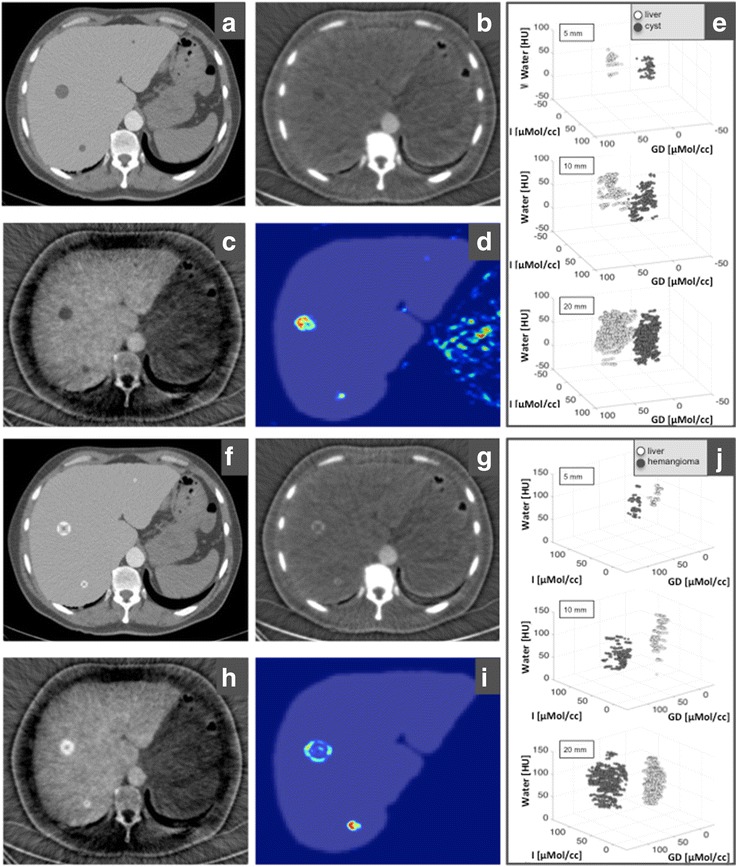
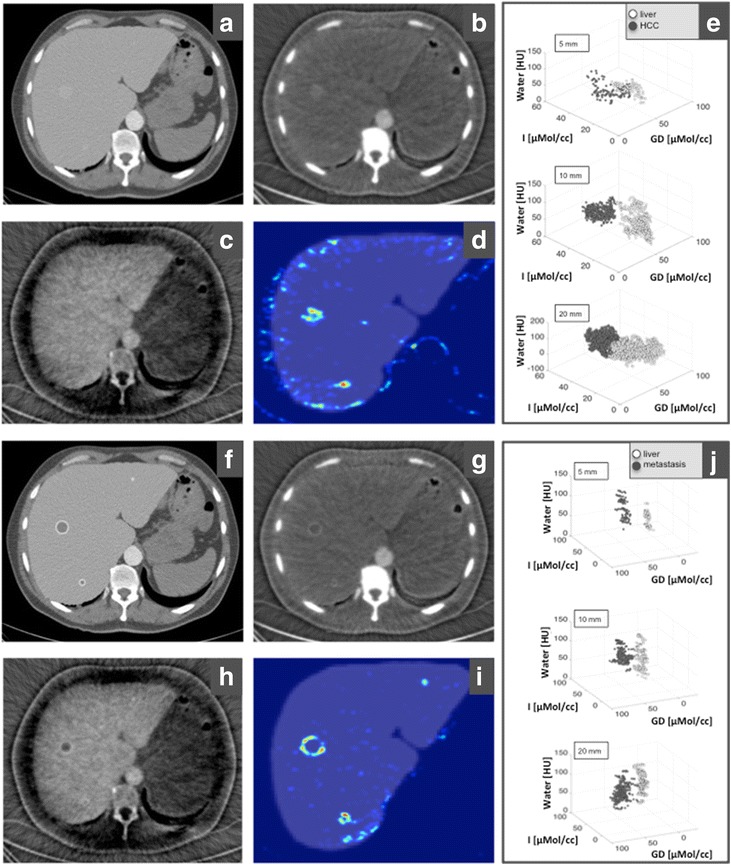
Methods: We present an SPCCT in-silico study for simultaneous mapping of the complementary distribution in the liver of two contrast agents (CAs) subsequently intravenously injected: a gadolinium-based contrast agent and an iodine-based contrast agent. Four types of simulated liver lesions with a characteristic arterial and portal venous pattern (haemangioma, hepatocellular carcinoma, cyst, and metastasis) are presented. A material decomposition was performed to reconstruct quantitative iodine and gadolinium maps. Finally, a multi-dimensional classification algorithm for automatic lesion detection is presented.

Results: Our simulations showed that with a single-scan SPCCT and an adapted contrast injection protocol, it was possible to reconstruct contrast-enhanced images of the liver with arterial distribution of the iodine-based CA and portal venous phase of the gadolinium-based CA. The characteristic patterns of contrast enhancement were visible in all liver lesions. The approach allowed for an automatic detection and classification of liver lesions using a multi-dimensional analysis.

Conclusions: Dual-contrast SPCCT should be able to visualise the characteristic arterial and portal venous enhancement with a single scan, allowing for an automatic lesion detection and characterisation, with a reduced radiation exposure.

Keywords: Computed tomography (CT); Dual-contrast computed tomography; Gadolinium mapping; Gadolinium-based contrast agent; Iodine mapping; Iodine-based contrast agent; Liver; Spectral photon-counting computed tomography (SPCCT).


Conflict of interest statement

HD and RP are employees of Philips Healthcare. The remaining authors (DM, AF, FK, FD, JH, FP, ER and PN) have no financial disclosures and had complete, unrestricted access to the study data at all stages of the study.Springer Nature remains neutral with regard to jurisdictional claims in published maps and institutional affiliations.

Figures

Fig. 1
Fig. 1
Injection protocol and timing characteristics for dual-contrast agent enhanced multi-phase SPCCT of the liver. The portal venous phase is reached within T3 (~70 s) following CA injection in humans, whereas the exact time point of arterial distribution (T1–T0) depends on the individual patient blood flow. For dual-contrast SPCCT imaging, synchronised portal venous distribution of CA1 and arterial distribution of CA2 at one time point is necessary (= T3). The sequence is started at T0, where CA1 is injected. At T3, CA1 shows a portal venous distribution. The time period T1–T0 defines the time necessary for enhancement in arterial phase. Then, CA2 is injected at T2 to assure arterial phase of CA2 at T3. At T3, the SPCCT scan is performed, with an arterial distribution of CA2 and a portal venous contrast of CA1. Blue dotted line, arterial distribution of CA1; blue line, portal venous distribution of CA1; red line, arterial distribution of CA2
Fig. 2
Fig. 2
Preparation of the patient-inspired in-silico synthetic liver model for the numerical SPCCT experiments. a Original CT image of a healthy liver, (b) segmented bone, (c) segmented soft tissues, and (d) liver part of the original CT image. The liver is removed from the soft tissue image and is replaced in the synthetic liver phantom with a homogenous attenuation of 50 HU
Fig. 3
Fig. 3
Selected shapes for the four liver lesions used in this study. The grey values indicate the distribution of the contrast uptake during the arterial and portal phase. Light grey stands for a high contrast uptake and dark grey for a low contrast uptake. The uptake of the HCC typically presents with a homogenous, high uptake during the arterial phase followed by washout in the portal phase. The haemangioma typically shows the ‘closing iris’ structure in the transition from arterial to portal venous distribution. The cyst does not uptake CA, in either the arterial or the portal venous phase. The metastasis has a small rim with a high CA uptake during both phases and a core with no enhancement during arterial phase and a low enhancement during the portal phase
Fig. 4
Fig. 4
SPCCT imaging of benign liver lesions, exemplified by cysts (ae) and haemangiomas (fj). a, f Conventional CT image. b Iodine-enhanced image, showing cysts without any contrast uptake in the arterial phase. c Gadolinium-enhanced image showing cysts in portal venous phase. g, h Iodine- and gadolinium-enhanced image of haemangiomas, with a typical closing-iris pattern. d Likelihood map showing the 20-mm, 10-mm, and 5-mm diameter cysts. i For haemangiomas, the smallest lesion was missed in the calculated likelihood map. e, j Scatter plots illustrate the results of integrative analysis of SPCCT images with regard to the content of iodine and gadolinium as well as the non-contrast fraction (= water) for all lesions and all sizes without significant overlap of liver parenchyma (light grey) and lesion (dark grey). For this, two ROIs in the three material images were evaluated; one ROI was placed in the lesion (dark grey markers) and the other in healthy liver tissue (light grey markers). Image windowing: a and f, level/window 50/300 HU; b and g, level/window 25/100 μmol/cc of iodined CA; c and h, level/window 25/100 μmol/cc of gadolinium-based CA
Fig. 5
Fig. 5
SPCCT imaging of malignant liver lesions, exemplified by HCC (ae) and metastasis (fj). a, f Conventional CT image. b Iodine-based image, showing HCC with a typical hyper-enhancement in arterial phase. c Gadolinium-based image of HCC in portal venous phase, which shows only subtle early washout with hypodense presentation in the largest lesion. g, h Iodine- and gadolinium-based image of metastases, with a typical ring-like enhancement in the arterial phase (g), increased in the portal venous phase (h). d Likelihood map for HCC, which shows HCC in the right lobe but misses the small lesion in the left lobe, due to artifacts along the liver contour. i For metastases, the likelihood map clearly illustrated all the three lesions. e, j The scatter plots show an overlap for the fractionised analysis for iodine, gadolinium and water for HCC (e, dark grey), whereas all metastases (j, dark grey) are clearly separated from liver parenchyma (e, j, light grey). For this, two ROIs in the three material images were evaluated, one placed in the lesion (dark grey markers) and the other one in healthy liver tissue (light grey markers). Image windowing: a and f, level/window 50/300 HU; b and g, level/window 25/100 μmol/cc of iodined CA; c and h, level/window 25/100 μmol/cc of gadolinium-based CA

References

    1. McGlynn KA, Petrick JL, London WT. Global epidemiology of hepatocellular carcinoma: an emphasis on demographic and regional variability. Clin Liver Dis. 2015;19:223–238. doi: 10.1016/j.cld.2015.01.001. - DOI - PMC - PubMed
    1. Cogley JR, Miller FH. MR imaging of benign focal liver lesions. Radiol Clin North Am. 2014;52:657–682. doi: 10.1016/j.rcl.2014.02.005. - DOI - PubMed
    1. Belghiti J, Cauchy F, Paradis V, et al. Diagnosis and management of solid benign liver lesions. Nat Rev Gastroenterol Hepatol. 2014;11:737–749. doi: 10.1038/nrgastro.2014.151. - DOI - PubMed
    1. Soyer P, Poccard M, Boudiaf M, et al. Detection of hypovascular hepatic metastases at triple-phase helical CT: sensitivity of phases and comparison with surgical and histopathologic findings. Radiology. 2004;231:413–420. doi: 10.1148/radiol.2312021639. - DOI - PubMed
    1. Portugaller HR, Stacher R, Komaz G, et al. The value of different spiral CT phases in the detection of liver metastases. Röfo. 2002;174:452–458. - PubMed