

Calibration and testing of a Raman hyperspectral imaging system to reveal powdered food adulteration
- PMID: 29708973
- PMCID: PMC5927415
- DOI: 10.1371/journal.pone.0195253
Calibration and testing of a Raman hyperspectral imaging system to reveal powdered food adulteration
Abstract
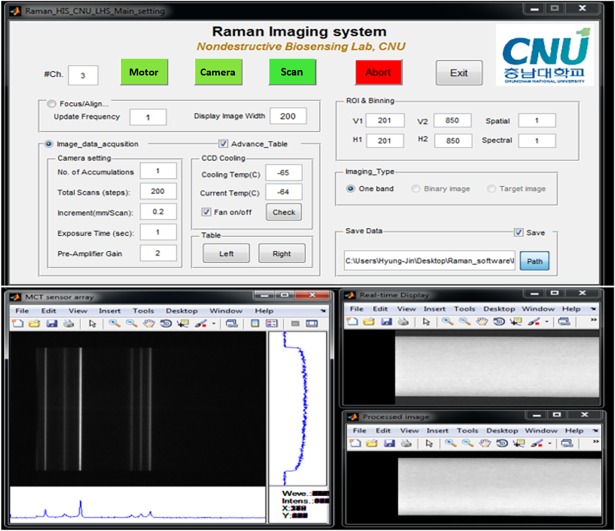
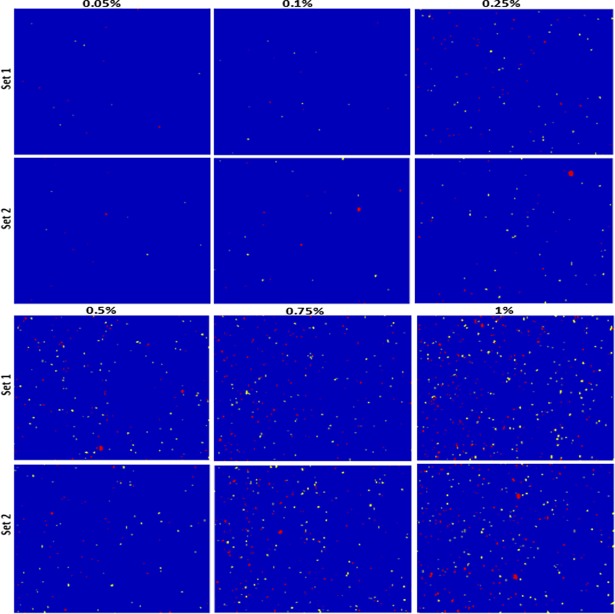
The potential adulteration of foodstuffs has led to increasing concern regarding food safety and security, in particular for powdered food products where cheap ground materials or hazardous chemicals can be added to increase the quantity of powder or to obtain the desired aesthetic quality. Due to the resulting potential health threat to consumers, the development of a fast, label-free, and non-invasive technique for the detection of adulteration over a wide range of food products is necessary. We therefore report the development of a rapid Raman hyperspectral imaging technique for the detection of food adulteration and for authenticity analysis. The Raman hyperspectral imaging system comprises of a custom designed laser illumination system, sensing module, and a software interface. Laser illumination system generates a 785 nm laser line of high power, and the Gaussian like intensity distribution of laser beam is shaped by incorporating an engineered diffuser. The sensing module utilize Rayleigh filters, imaging spectrometer, and detector for collection of the Raman scattering signals along the laser line. A custom-built software to acquire Raman hyperspectral images which also facilitate the real time visualization of Raman chemical images of scanned samples. The developed system was employed for the simultaneous detection of Sudan dye and Congo red dye adulteration in paprika powder, and benzoyl peroxide and alloxan monohydrate adulteration in wheat flour at six different concentrations (w/w) from 0.05 to 1%. The collected Raman imaging data of the adulterated samples were analyzed to visualize and detect the adulterant concentrations by generating a binary image for each individual adulterant material. The results obtained based on the Raman chemical images of adulterants showed a strong correlation (R>0.98) between added and pixel based calculated concentration of adulterant materials. This developed Raman imaging system thus, can be considered as a powerful analytical technique for the quality and authenticity analysis of food products.
Conflict of interest statement
Figures


References
-
- Lohumi S, Lee S, Lee H, Cho BK. A review of vibrational spectroscopic techniques for the detection of food authenticity and adulteration. Trends Food Science Technol. 2015;46: 85–98.
-
- Branigan T. (2008). In the Guardian, Guardian News and Media, London.
-
- Everstine K. (2013). Economically motivated adulteration: Implication for food protection and alternate approaches to detection. Doctorate thesis. University of Minnesota.
-
- Zhao J, Peng Y, Chao K, Qin J, Dhakal S, Xu T. Rapid detection of benzoyl peroxide in wheat flour by using Raman scattering spectroscopy. SPIE 9488, Sensing for Agriculture and Food Quality and Safety VII. 2015. p. 94880S
-
- Ponhong K, Supharoek SA, Siriangkhawut W, Grudpan K. A rapid and sensitive spectrophotometric method for the determination of benzoyl peroxide in wheat flour samples. J food drug Anal. 2015;23: 652–659. doi: 10.1016/j.jfda.2015.03.006 - DOI - PMC - PubMed
Publication types
MeSH terms
Substances
LinkOut - more resources
Full Text Sources
Other Literature Sources
Medical
