. 2018 Apr 30;13(4):e0193922.
doi: 10.1371/journal.pone.0193922. eCollection 2018.

Structural and functional dissection of differentially expressed tomato WRKY transcripts in host defense response against the vascular wilt pathogen (Fusarium oxysporum f. sp. lycopersici)

Affiliations

Structural and functional dissection of differentially expressed tomato WRKY transcripts in host defense response against the vascular wilt pathogen (Fusarium oxysporum f. sp. lycopersici)

Mohd Aamir et al. PLoS One. .

Abstract

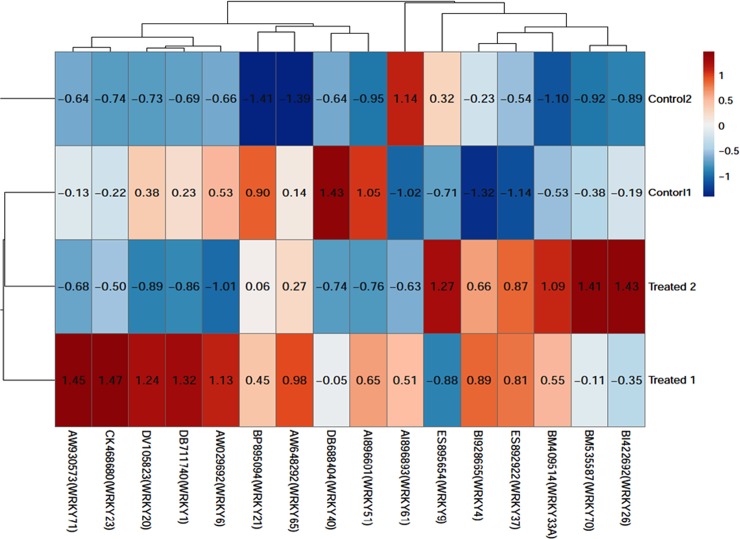
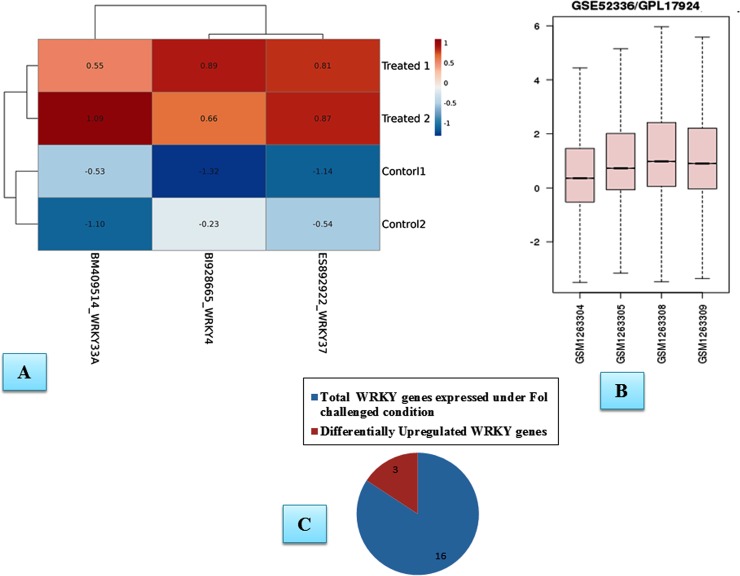
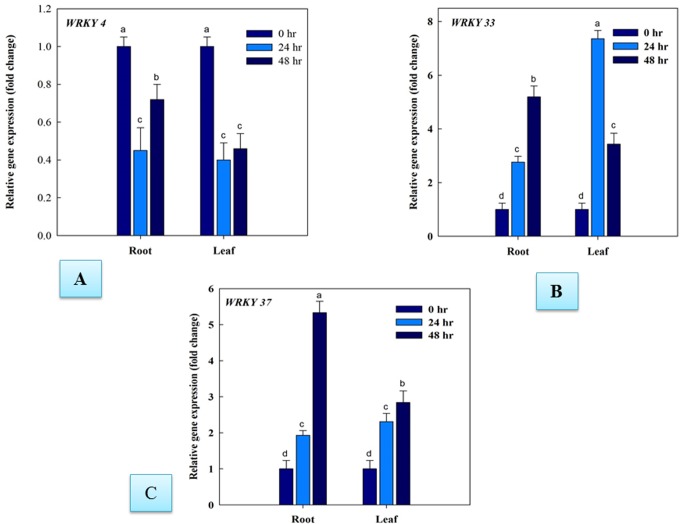
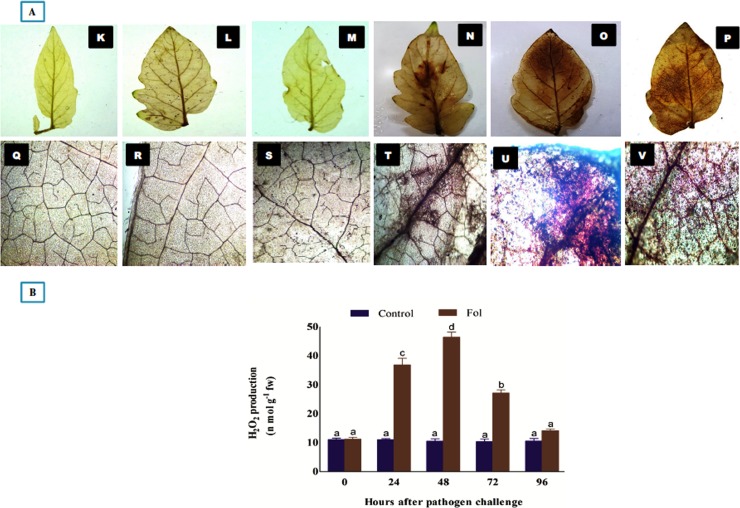
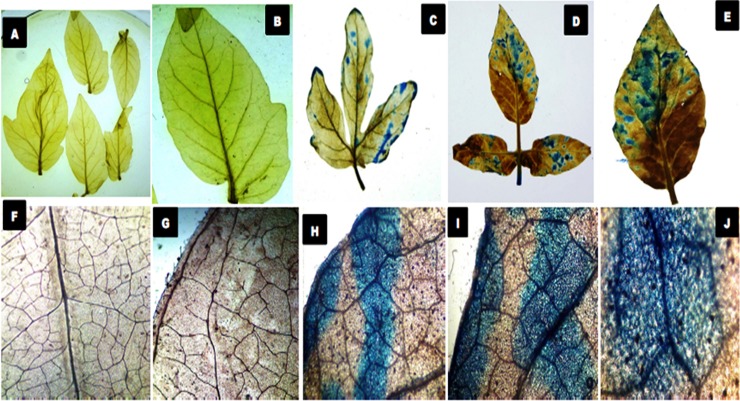
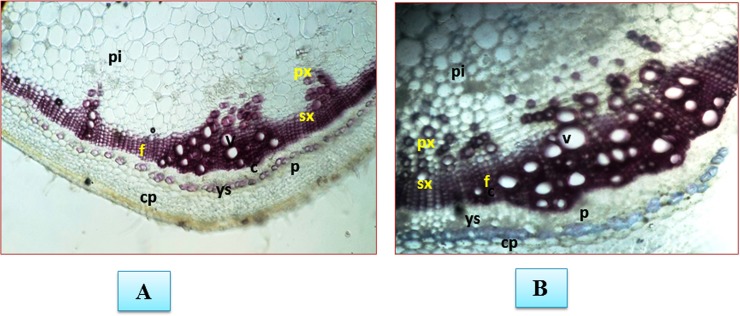
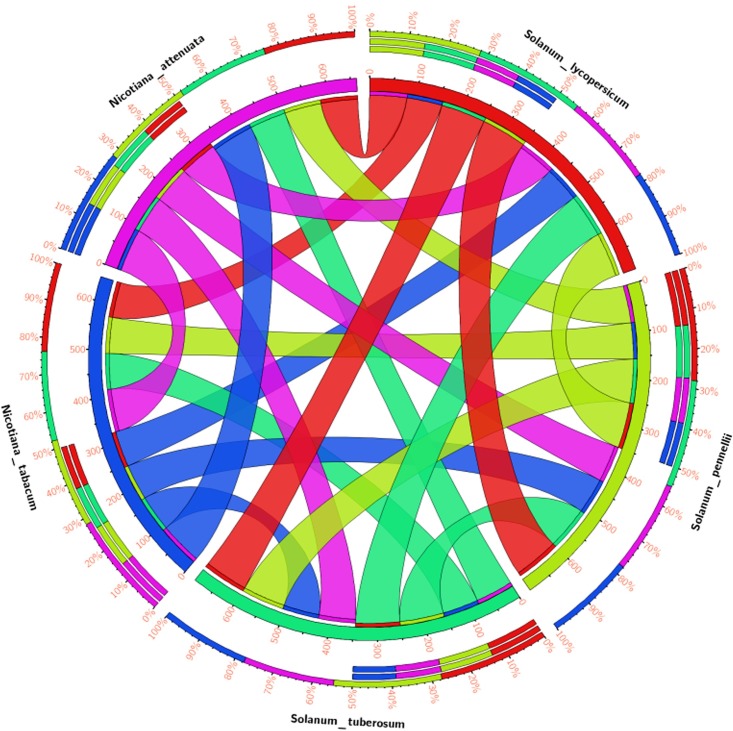
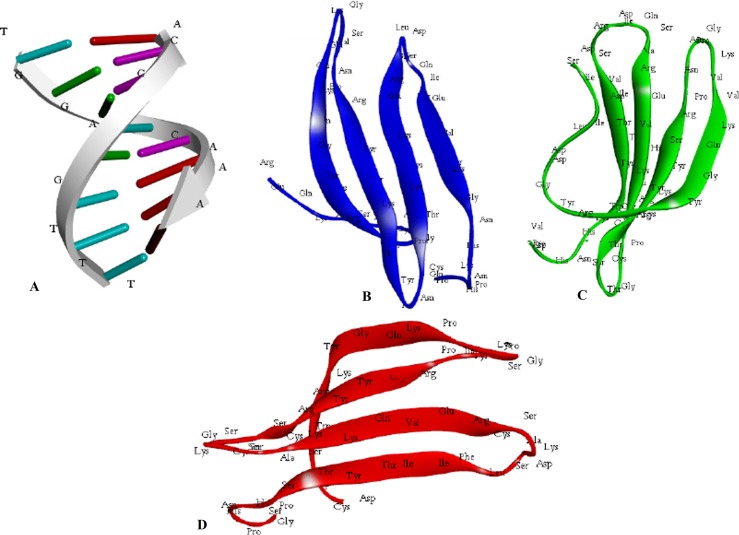
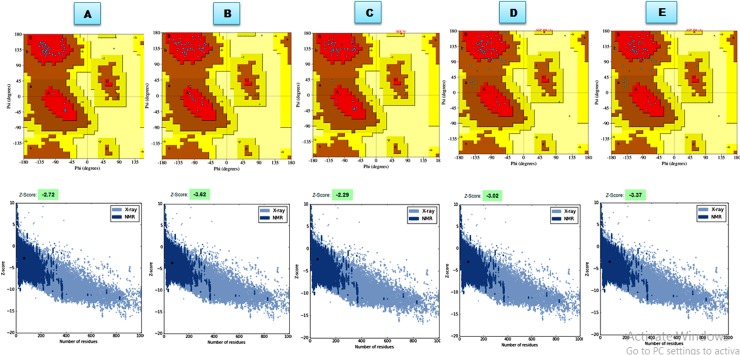
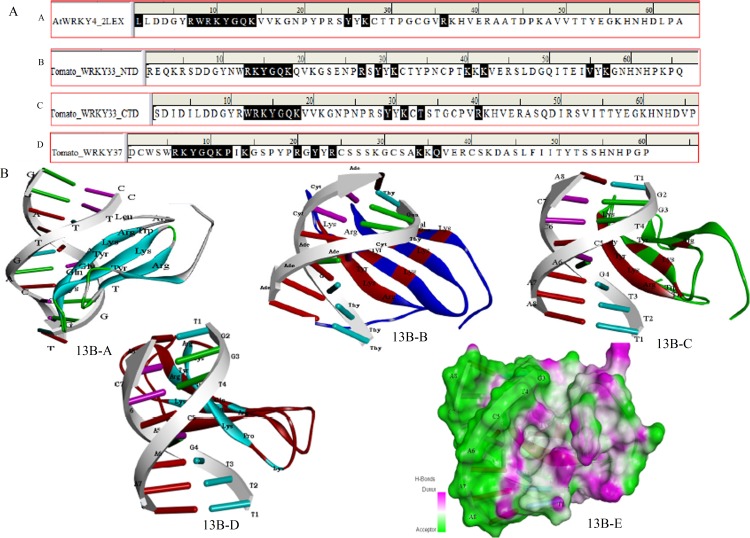
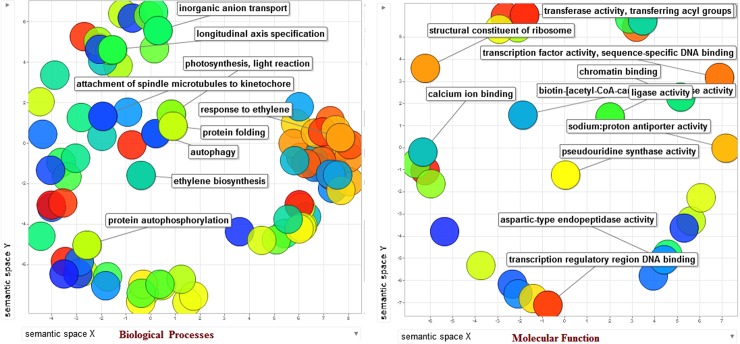
The WRKY transcription factors have indispensable role in plant growth, development and defense responses. The differential expression of WRKY genes following the stress conditions has been well demonstrated. We investigated the temporal and tissue-specific (root and leaf tissues) differential expression of plant defense-related WRKY genes, following the infection of Fusarium oxysporum f. sp. lycopersici (Fol) in tomato. The genome-wide computational analysis revealed that during the Fol infection in tomato, 16 different members of WRKY gene superfamily were found to be involved, of which only three WRKYs (SolyWRKY4, SolyWRKY33, and SolyWRKY37) were shown to have clear-cut differential gene expression. The quantitative real time PCR (qRT-PCR) studies revealed different gene expression profile changes in tomato root and leaf tissues. In root tissues, infected with Fol, an increased expression for SolyWRKY33 (2.76 fold) followed by SolyWRKY37 (1.93 fold) gene was found at 24 hrs which further increased at 48 hrs (5.0 fold). In contrast, the leaf tissues, the expression was more pronounced at an earlier stage of infection (24 hrs). However, in both cases, we found repression of SolyWRKY4 gene, which further decreased at an increased time interval. The biochemical defense programming against Fol pathogenesis was characterized by the highest accumulation of H2O2 (at 48 hrs) and enhanced lignification. The functional diversity across the characterized WRKYs was explored through motif scanning using MEME suite, and the WRKYs specific gene regulation was assessed through the DNA protein docking studies The functional WRKY domain modeled had β sheets like topology with coil and turns. The DNA-protein interaction results revealed the importance of core residues (Tyr, Arg, and Lys) in a feasible WRKY-W-box DNA interaction. The protein interaction network analysis revealed that the SolyWRKY33 could interact with other proteins, such as mitogen-activated protein kinase 5 (MAPK), sigma factor binding protein1 (SIB1) and with other WRKY members including WRKY70, WRKY1, and WRKY40, to respond various biotic and abiotic stresses. The STRING results were further validated through Predicted Tomato Interactome Resource (PTIR) database. The CELLO2GO web server revealed the functional gene ontology annotation and protein subcellular localization, which predicted that SolyWRKY33 is involved in amelioration of biological stress (39.3%) and other metabolic processes (39.3%). The protein (SolyWRKY33) most probably located inside the nucleus (91.3%) with having transcription factor binding activity. We conclude that the defense response following the Fol challenge was accompanied by differential expression of the SolyWRKY4(↓), SolyWRKY33(↑) and SolyWRKY37(↑) transcripts. The biochemical changes are occupied by elicitation of H2O2 generation and accumulation and enhanced lignified tissues.


Conflict of interest statement

Competing Interests: The authors have declared that no competing interests exist.

Figures

Fig 1
Fig 1. Heat map generated through ClustVis showing clustering of multivariate data values of differentially expressed and upregulated WRKY genes.
Fig 2
Fig 2
A. Heat map diagramme showing the differentially upregulated WRKY transcripts (SolyWRKY4, SolyWRKY33 and SolyWRKY37) B. Distribution of expression values for each selected samples (Two control GSM1263304_rep1 and GSM1263305 and two Fol challenged samples (GSM1263308_rep1 and 12623309_ rep2) represented in the form of box plot diagrame. The box plot diagrame for selected samples are not median centred (higher distribution values for treated samples compared to inoculated samples. C. The pie chart showing the number of differentially upregulated WRKY transcripts in tomato from total expressed WRKY genes under the Fol challenged conditions.
Fig 3
Fig 3. Quantitative PCR results showing the tissue specific differential expression of tomato WRKY genes expressed under the Fol challenged conditions at different time intervals (0, 24hrs and 48 hrs).
The data represent the relative fold changes expression values of Fol treated samples compared to untreated (control) samples. The SolyWRKY33 and SolyWRKY37 genes were found to be upregulated as revealed through quantitative PCR. The SolyWRKY4 genes were found to be downregulated in both root and leaf tissues.
Fig 4
Fig 4. The differential expression of the replicated count data analyzed at different time interval and from different tissues.
The heat map diagramme was generated through and Bioconductor R using the fold change expression values and were compared with control samples.
Fig 5
Fig 5
A. Histochemical staining for observation of accumulated H2O2 in control and Fol toxins exposed leaf tissues (DAB staining) at 48 hrs post inoculation of Fol toxins. K, L and M. General view of control leaf samples. Q, R and S. microscopic observation of control leaf tissues. N and O. Fol toxins exposed leaf tissues (attached) showing the accumulated H2O2 along the midrib, leaf margins and tips. T and U. Microscopic observation of the treated tissues accumulating higher amount of H2O2 along the midrib and leaf tips. P and V. Higher accumulation of H2O2 in leaf tissues (de-attached) 5B. Biochemical assessment of H2O2 produced at different time interval. The H2O2 produced was higher at 24 hrs, become maximum at 48 hrs and decreases successively at increased time interval. The control tissues had more or less similar amount of H2O2 produced.
Fig 6
Fig 6. Histochemical analysis for the assessment of cell death.
The leaves (both attached and detached with plants) were treated with culture filtrate of (Fol). The microscopic observation of the Fol toxins exposed necrotic lesions developed that eventually leads into cell death and was observed using Evan Blue stain. A and B. General view of control leaf samples. C and D. General view of Fol toxins exposed leaf tissues (attached) with having intense blue coloration showed the dead tissues. E. General view of Fol toxins exposed and unattached leaf tissue. F and G. Microscopic observation of control leaf samples. H and I. The microscopic observation of the leaf tissues (attached) showing the binding of Evans dye with dead tissues. J De-attached leaves observed at higher resolution.
Fig 7
Fig 7. Assessment of plant defense response in the form of lignification.
The pink colour shows the amount of lignified tissues. The shoot tissues between the second and third nodes from Fol challenged plants were collected after 3 weeks post inoculation. The photograph were taken after staining with phloroglucinol-HCl A. Control B. Fol challenged plants. Transverse section of tomato stem stained with pholoroglucinol-HCl at 2nd internode showing the lignified tissues in pink colour px = primary xylem; sx = secondary xylem; f = xylem; pi = pith; p = phloem; c = cambium; v = vessel; cp, cortical parenchyma. In control sample the amount of lignin deposition is less. The Fol challenged stem showed the intense pink coloration of the lignified tissues and the high intensity of pink colour in samples represent the high amount of lignified material deposited.
Fig 8
Fig 8. The circos genome visualization map for identifying the similarities and differences to identify the similarities and differences in SolyWRKY33 proteins as compared with other homologs and orthologs members and revealed through the comparative genomics.
The map is based on the percentage identity matrices obtained during phylogenetic clustering of the sequences using Clustal W at 0% cut- off filter values. The thickness of the coloured band represents their respective relationship with other members.
Fig 9
Fig 9. The circos visualization maps to identify the similarities and differences in SolyWRKY37 proteins as compared with other homologs members and revealed through the comparative genomics.
The thick coloured bands for SolyWRKY37 with other members of tomato family predict their close phylogenetic relationship. The map is based on the percentage identity matrices obtained during phylogenetic clustering of the sequences using Clustal W at 0% cut- off filter values. The thickness of the coloured band represents their respective relationship with other members.
Fig 10
Fig 10
A. Interaction network of WRKY33 protein in Arabidopsis homologue of tomato. The color nodes represent the query protein and first shell of interactors whereas; white nodes are second shell of interactors. The large node sized interactors represent those proteins which have been well characterized whereas the small node sizes represent proteins uncharacterized B. Functional associative network of WRKY 33 protein in tomato C. The Arabidopsis WRKY33 protein interactive network obtained from Predicted Tomato Interactome Resource (PTIR) database.
Fig 11
Fig 11
A. Structural modeling of the functional domain of SolyWRKY33 protein at both N-terminal and C-terminal end and W-box DNA using DS Modeller A. Structure of the modeled W-box DNA B. The N-terminal SolyWRKY33 domain (NTD) C. The C-terminal SolyWRKY33 domain (CTD) D. The SolyWRKY37 WRKY domain.
Fig 12
Fig 12
The stereo chemical spatial arrangement of amino acid residues in the modeled domain structure for SolyWRKY33 NTD A. The modeled SolyWRKY33 CTD B. modelled SolyWRKY37 C. The results were compared with Ramachandran plots available for experimentally deduced structures (template) Solution Structure of the C-terminal WRKY Domain of AtWRKY4 (1WJ2) D. Crystal Structure of the C-terminal WRKY domain of AtWRKY1 (2AYD) E. The plot calculations on the 3D model of WRKY proteins were computed with the PROCHECK server. Most favoured regions are coloured red, additional allowed, generously allowed, and disallowed regions are indicated as yellow, light yellow and white fields, respectively.
Fig 13
Fig 13. The sequential representation of the ligand interacting residues in the WRKY-DNA docked complexes.
13A-A. Interaction of X-Ray determined crystal structure of docked complex of AtWRKY4 CTD with W-box DNA. 13A-B. Docking of SolyWRKY33 NTD with W-box element 13A-C. Docking of functional SolyWRKY33 CTD. 13A-D. Docking of functional SolyWRKY37 domain with W-box DNA. 13 B. Docking representations (pictorial) of molecular complexes of W-box DNA with functional WRKY domain. 13B-A. Interaction of X-Ray determined crystal structure of docked complex of AtWRKY4 CTD with W-box DNA. 13B-B. Docking of SolyWRKY33 NTD with W-box element. 13B-B. Docking of functional SolyWRKY33 CTD. 13B-C. Docking of functional SolyWRKY33 CTD with W-box DNA. 13B-D. Docking of functional SolyWRKY37 domain with W-box DNA. 13B-E. The three dimensional surface view for the WRKY- DNA interaction highlighting the docked regions in terms of H bond donar and acceptor groups in the docked complexes.
Fig 14
Fig 14. Scattered plot analysis for the redundant gene ontology (GO) terms based on the controlled functional vocabularies concentrated around the two ontological terms including biological process and molecular function.
The first five significant terms were shown on scattered plots.
Fig 15
Fig 15. The subcellular localization of the predicted protein with functional gene annotation using CELLO2GO web server.
The functional vocabularies’ are represented in pie chart diagrame evaluating the significant terms in form of their percentage contribution.

References

    1. Gupta S, Rashotte AM. Expression patterns and regulation of SlCRF3 and SlCRF5 response to cytokinin and abiotic stresses in tomato (Solanum lycopersicum). J Plant Physiol. 2014; 171:349–358. 10.1016/j.jplph.2013.09.003 - DOI - PubMed
    1. Bergougnoux V. The history of tomato: from domestication to biopharming. Biotechnol Adv. 2014; 32:170–189. 10.1016/j.biotechadv.2013.11.003 - DOI - PubMed
    1. Panthee DR, Feng C. Genomics of fungal disease resistance in tomato. Curr Genomics. 2010; 11:13039 10.2174/138920210790217927 - DOI - PMC - PubMed
    1. Rongai D, Pulcini P, Pesce B, Milano F. Antifungal activity of pomegranate peel extract against fusarium wilt of tomato. Eur J Plant Pathol. 2017; 147:229–238.
    1. Asha BB, Nayaka CS, Shankar UA, Srinivas C, Niranjana SR. Biological control of F. oxysporum f. sp. lycopersici causing wilt of tomato by Pseudomonas fluorescens. Int J Microbial Res. 2011; 3:79.

MeSH terms

LinkOut - more resources