. 2018 Apr 30;13(4):e0196749.
doi: 10.1371/journal.pone.0196749. eCollection 2018.

Relationship between brain plasticity, learning and foraging performance in honey bees

Affiliations

Relationship between brain plasticity, learning and foraging performance in honey bees

Amélie Cabirol et al. PLoS One. .

Abstract

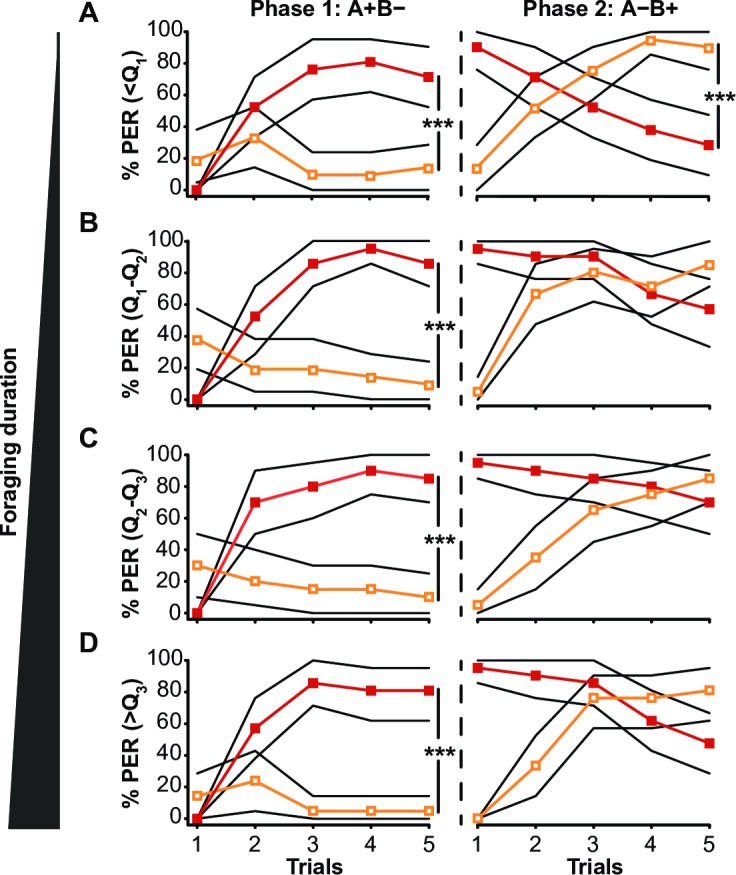
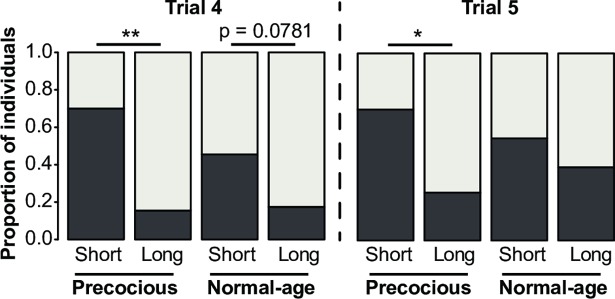
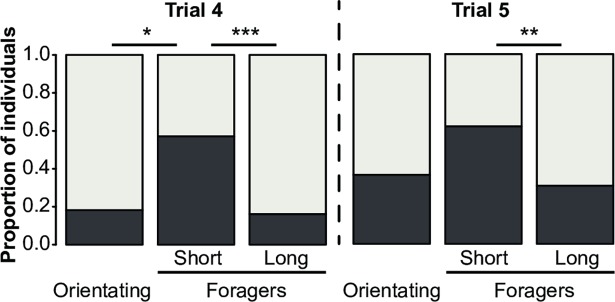
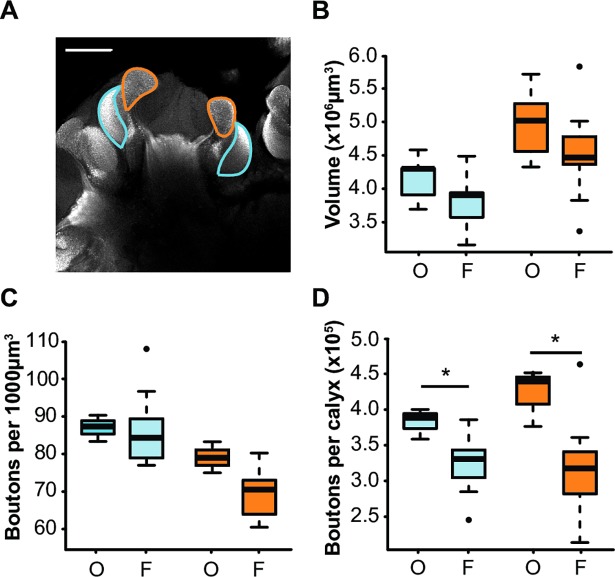
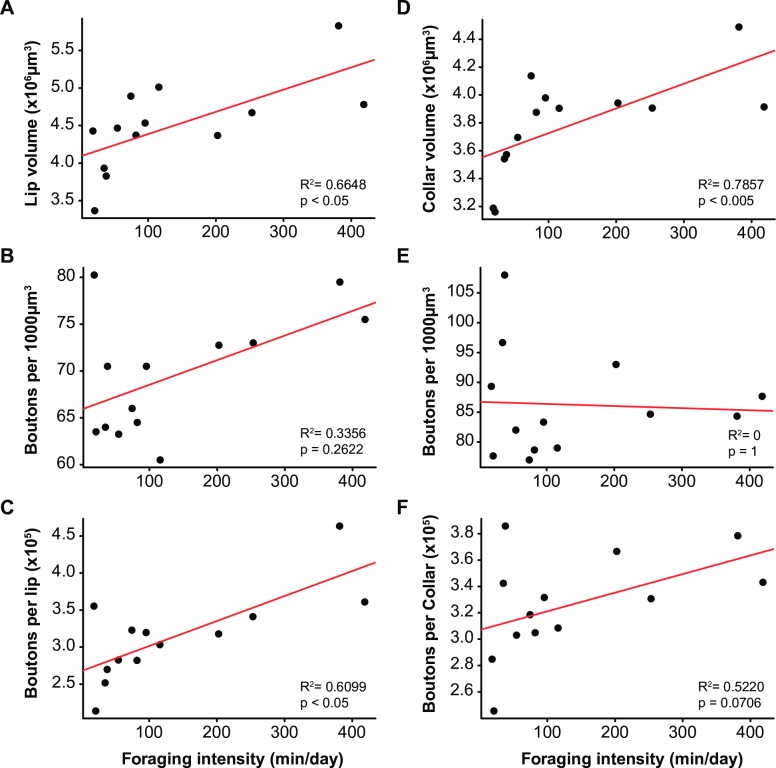
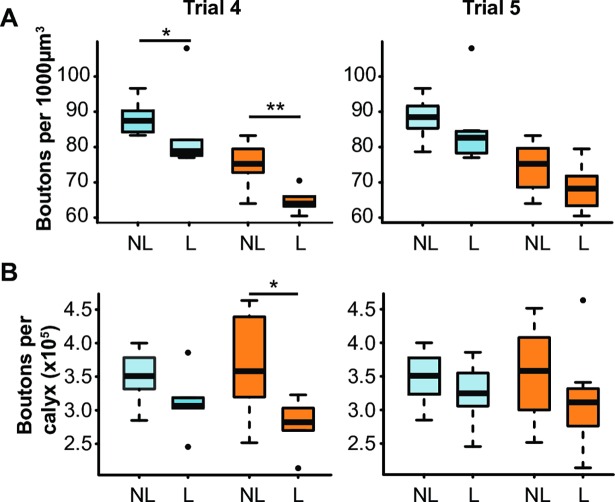
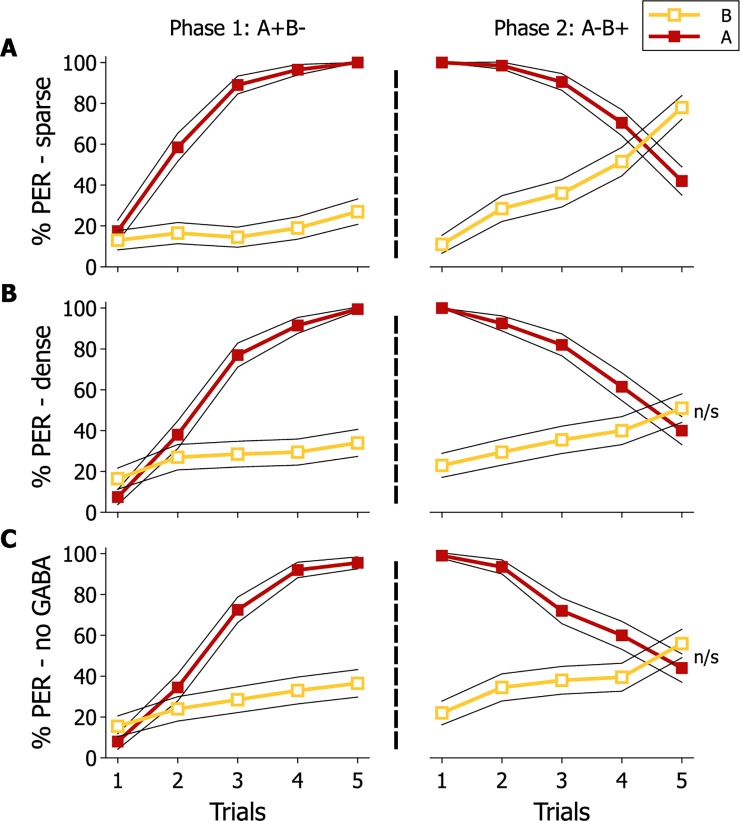
Brain structure and learning capacities both vary with experience, but the mechanistic link between them is unclear. Here, we investigated whether experience-dependent variability in learning performance can be explained by neuroplasticity in foraging honey bees. The mushroom bodies (MBs) are a brain center necessary for ambiguous olfactory learning tasks such as reversal learning. Using radio frequency identification technology, we assessed the effects of natural variation in foraging activity, and the age when first foraging, on both performance in reversal learning and on synaptic connectivity in the MBs. We found that reversal learning performance improved at foraging onset and could decline with greater foraging experience. If bees started foraging before the normal age, as a result of a stress applied to the colony, the decline in learning performance with foraging experience was more severe. Analyses of brain structure in the same bees showed that the total number of synaptic boutons at the MB input decreased when bees started foraging, and then increased with greater foraging intensity. At foraging onset MB structure is therefore optimized for bees to update learned information, but optimization of MB connectivity deteriorates with foraging effort. In a computational model of the MBs sparser coding of information at the MB input improved reversal learning performance. We propose, therefore, a plausible mechanistic relationship between experience, neuroplasticity, and cognitive performance in a natural and ecological context.


Conflict of interest statement

Competing Interests: The authors have declared that no competing interests exist.

Figures

Fig 1
Fig 1. Change in reversal learning performance with duration of foraging.
Percentages of individuals displaying PER in response to odours A (red line) and B (orange line) are shown, during the first phase (A+B-) and the reversal phase (A-B+) of the reversal learning task. Results are presented for bees with increasing foraging durations defined by the 1st quartile (Q1 = 113.8min), median (Q2 = 381.3min), and 3rd quartile (Q3 = 653.5min) of the total amount of time foraging of the whole sample. The bootstrapped 95% confidence intervals are indicated by the black lines. [(A): n = 21, (B): n = 21, (C): n = 20, (D): n = 21] *** p < 0.0001, Tukey HSD post hoc analysis.
Fig 2
Fig 2. Reversal learning performance of precocious and normal-age foragers with short or long foraging durations.
The proportions of non-learners (NL: light grey) and learners (L: dark grey) in the last two trials of the reversal phase (trials 4 and 5) are displayed. For each trial, bees were defined as non-learners or learners according to the value of their individual inversion score (see Methods; NL: IS = -1 or 0; L: IS = 1). The IS were compared between precocious and normal-age foragers, with either short or long foraging durations corresponding respectively to durations within or greater than the 1st quartile of the whole sample (113.8min). [Precocious: short: n = 10, long: n = 39; Normal-age: short: n = 11, long: n = 23] * p < 0.01; ** p < 0.005, Mann-Whitney U-test.
Fig 3
Fig 3. Reversal learning performances of orientating bees and foragers with short or long foraging durations.
The proportions of non-learners (NL: light grey) and learners (L: dark grey) in the last two trials of the reversal phase (trial 4 and 5) are displayed. For each trial, bees were defined as learners or non-learners according to the value of their individual inversion score (see Methods; NL: IS = -1 or 0; L: IS = 1). The IS are compared between orientating bees and foragers, with either short or long foraging durations corresponding respectively to durations within or outside the 1st quartile of the whole sample (113.8min). [Orientating: n = 11; Foragers-Short: n = 21; Foragers-Long: n = 62] * p < 0.05; ** p < 0.01; *** p < 0.0005, Mann-Whitney U-Test.
Fig 4
Fig 4. Mushroom body structure of orientating bees and foragers.
(A) Frontal confocal image of the right median MB labelled for synapsin (scale bar = 100μm). Borders of the lip (orange) and dense collar (blue) are highlighted. Boxplots showing the characteristics of the dense collar (blue) and lip (orange) of a sample of orientating bees (O, n = 5) and foragers (F, n = 13): (B) neuropil volume, (C) density of synaptic boutons, (D) number of synaptic boutons per neuropil. * p < 0.05, Mann-Whitney U-Test.
Fig 5
Fig 5. Correlations between foraging intensity and structural characteristics of the mushroom bodies.
Individual values (n = 13) for the parameters of the lip (A, B, C) and dense collar (D, E, F) are plotted against foraging intensity: neuropilar volume (A, D), density of synaptic boutons (B, E), total number of synaptic boutons (C, F). The volume of the lip and collar, as well as the total number of boutons per lip, correlate positively with foraging intensity (Spearman rank correlations).
Fig 6
Fig 6. Synaptic bouton density and number and reversal learning performance.
Boxplots showing the characteristics of the dense collar (blue) and lip (orange) of non-learners (NL, IS = -1 or 0) and learners (L, IS = 1) for each of the last two trials of the reversal phase: (A) density of synaptic boutons, (B) number of synaptic boutons per neuropil. [Trial 4: n = 12 NL and 6 L; Trial 5: n = 10 NL and 8 L] * p < 0.05, ** p < 0.005, Mann-Whitney U-Test.
Fig 7
Fig 7. Modelled consequences of varying MB connectivity on reversal learning performance.
Modelled percentage of individuals displaying PER in response to odours A (red line) and B (orange line) during the reversal learning paradigm. Three different models were run simulating a sparse (A) or dense (B) distribution of excitatory connections onto MB neurons (KC), and (C) sparse with suppressed inhibitory input from the GABAergic PCT. 200 agents (virtual bees) were modelled for each model configuration. The 95% confidence intervals are represented by the black lines.

References

    1. Doidge N. The brain that changes itelf Viking press; 2007.
    1. Kanai R, Rees G. The structural basis of inter-individual differences in human behaviour and cognition. Nat Rev Neurosci. Nature Publishing Group; 2011;12: 231–242. doi: 10.1038/nrn3000 - DOI - PubMed
    1. Caroni P, Donato F, Muller D. Structural plasticity upon learning: regulation and functions. Nat Rev Neurosci. Nature Publishing Group; 2012;13: 478–490. doi: 10.1038/nrn3258 - DOI - PubMed
    1. Tonegawa S, Pignatelli M, Roy DS, Ryan J. Memory engram storage and retrieval. Curr Opin Neurobiol. 2015;35: 101–109. doi: 10.1016/j.conb.2015.07.009 - DOI - PubMed
    1. Withers GS, Fahrbach SE, Robinson GE. Selective neuroanatomical plasticity and division of labour in the honeybee. Nature. 1993;364: 238–240. doi: 10.1038/364238a0 - DOI - PubMed

Publication types