Comparative Study
. 2018 Sep;67(9):1867-1879.
doi: 10.2337/db18-0158. Epub 2018 Apr 30.

Restructuring of the Gut Microbiome by Intermittent Fasting Prevents Retinopathy and Prolongs Survival in db/db Mice

Affiliations
Comparative Study

Restructuring of the Gut Microbiome by Intermittent Fasting Prevents Retinopathy and Prolongs Survival in db/db Mice

Eleni Beli et al. Diabetes. 2018 Sep.

Abstract

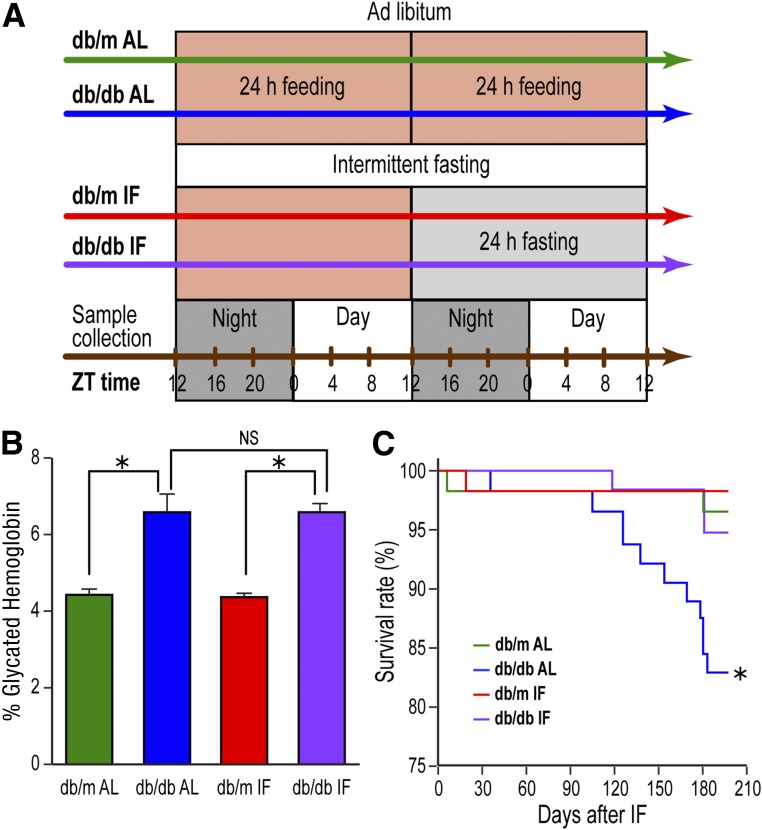
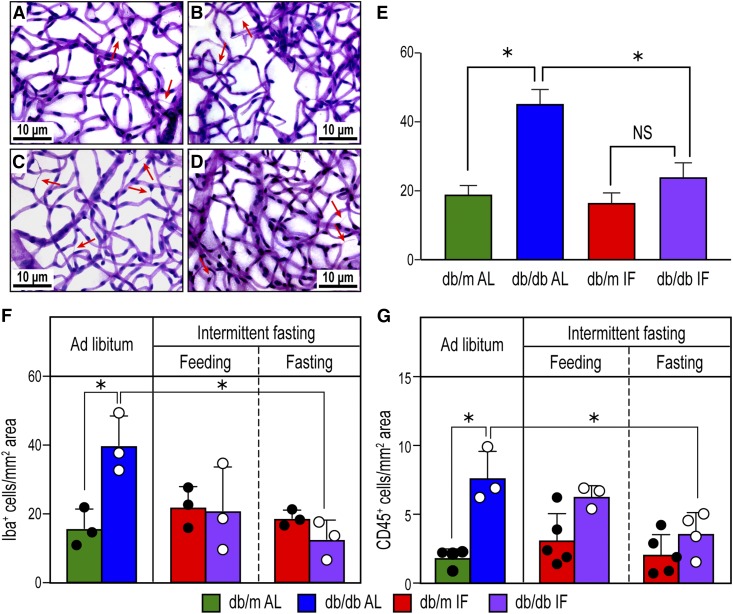
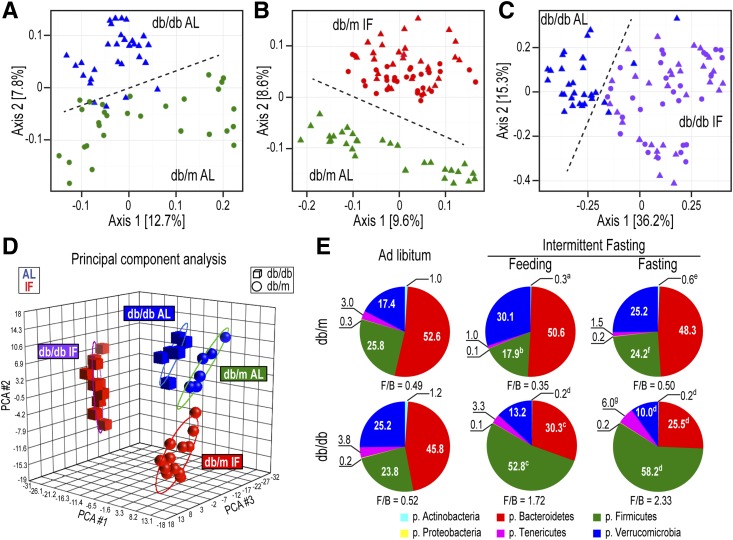
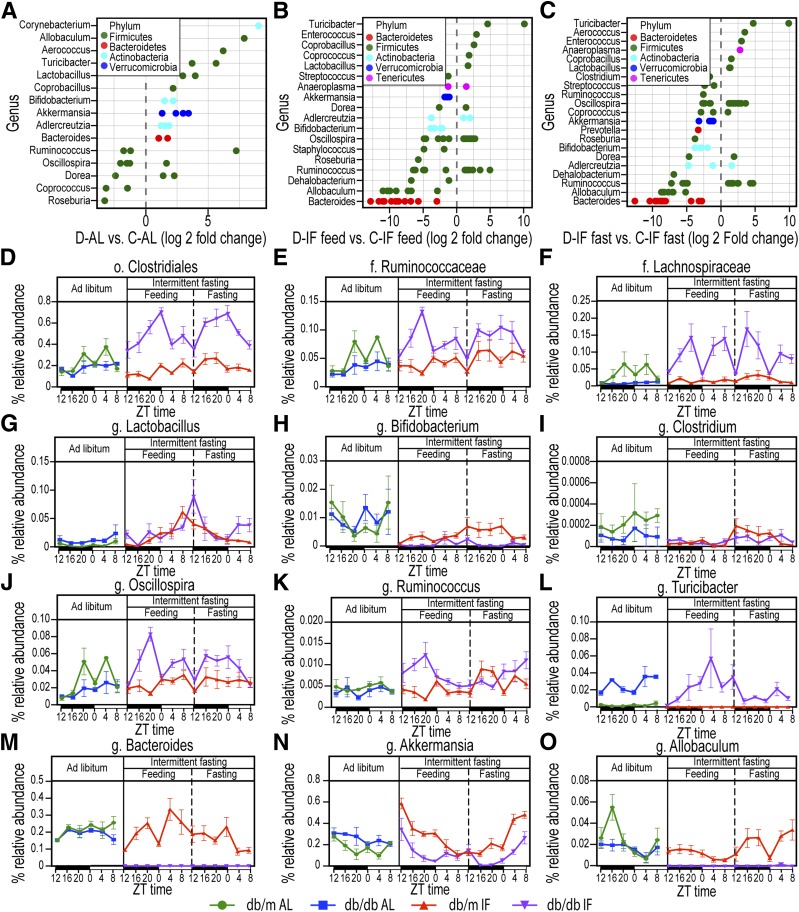
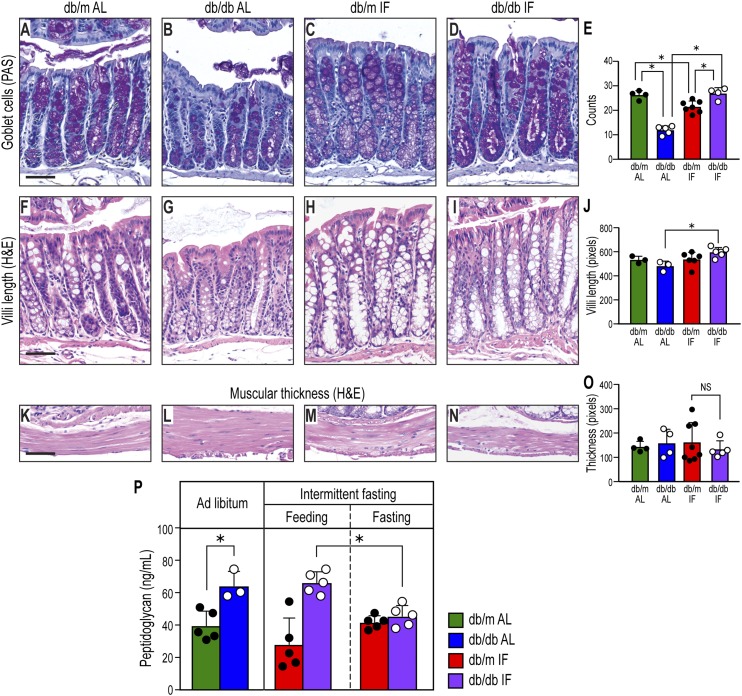
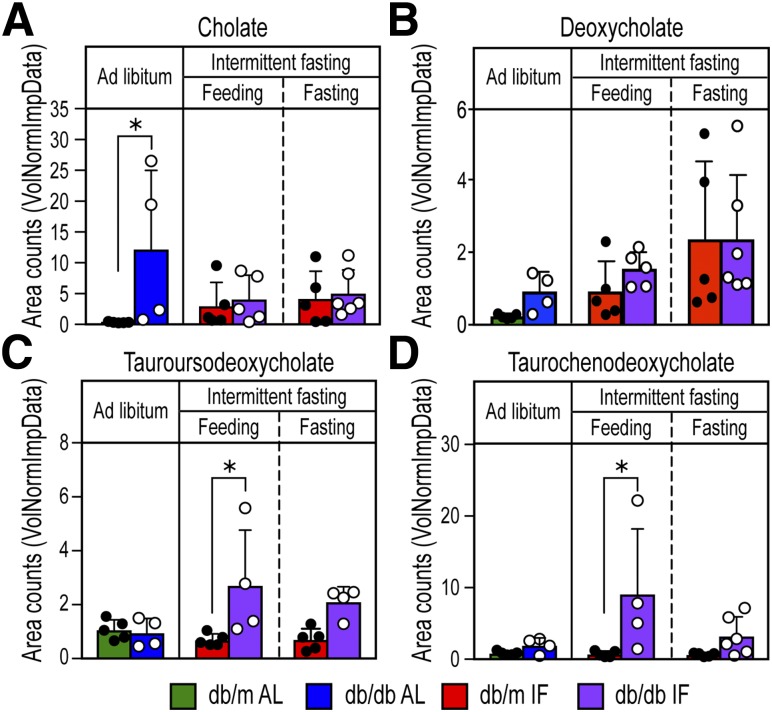
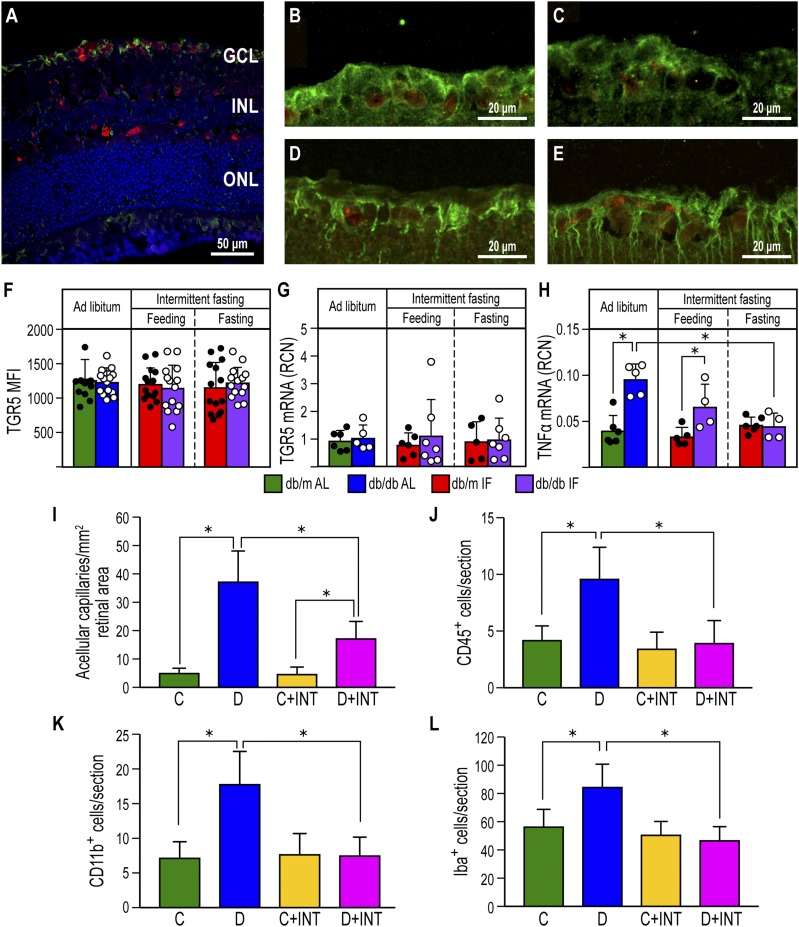
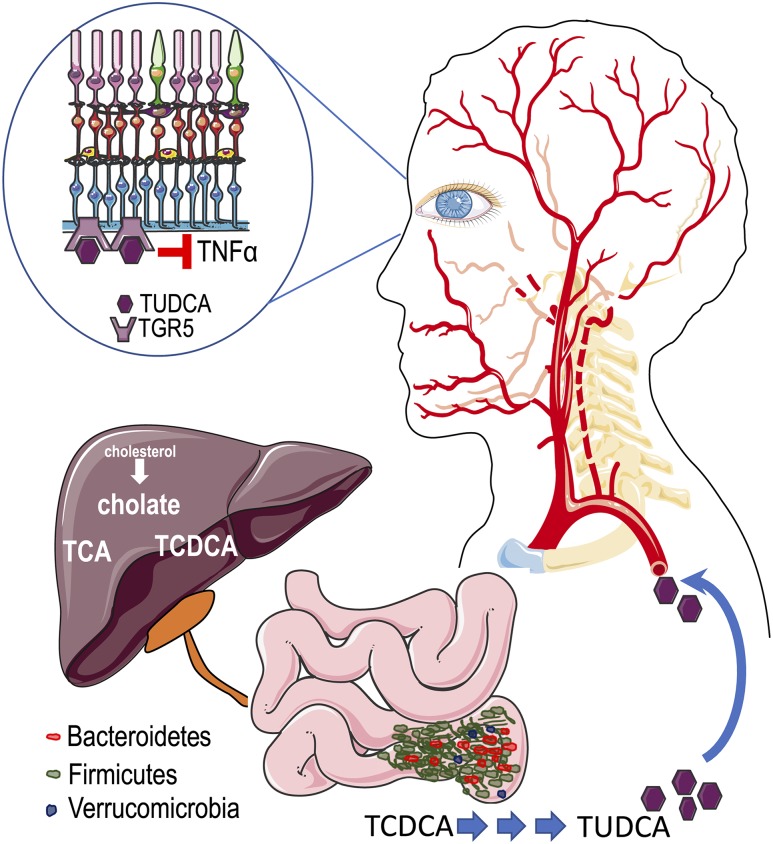
Intermittent fasting (IF) protects against the development of metabolic diseases and cancer, but whether it can prevent diabetic microvascular complications is not known. In db/db mice, we examined the impact of long-term IF on diabetic retinopathy (DR). Despite no change in glycated hemoglobin, db/db mice on the IF regimen displayed significantly longer survival and a reduction in DR end points, including acellular capillaries and leukocyte infiltration. We hypothesized that IF-mediated changes in the gut microbiota would produce beneficial metabolites and prevent the development of DR. Microbiome analysis revealed increased levels of Firmicutes and decreased Bacteroidetes and Verrucomicrobia. Compared with db/db mice on ad libitum feeding, changes in the microbiome of the db/db mice on IF were associated with increases in gut mucin, goblet cell number, villi length, and reductions in plasma peptidoglycan. Consistent with the known modulatory effects of Firmicutes on bile acid (BA) metabolism, measurement of BAs demonstrated a significant increase of tauroursodeoxycholate (TUDCA), a neuroprotective BA, in db/db on IF but not in db/db on AL feeding. TGR5, the TUDCA receptor, was found in the retinal primary ganglion cells. Expression of TGR5 did not change with IF or diabetes. However, IF reduced retinal TNF-α mRNA, which is a downstream target of TGR5 activation. Pharmacological activation of TGR5 using INT-767 prevented DR in a second diabetic mouse model. These findings support the concept that IF prevents DR by restructuring the microbiota toward species producing TUDCA and subsequent retinal protection by TGR5 activation.


Figures

Figure 1
Figure 1
IF feeding prolonged survival of db/db mice without improving glycemic control. A: Depiction of the experimental protocol with the treatment groups. Mice were put on IF diet at 4 months of age and were held on IF for 7 months. ZT represents zeitgeber time, i.e., time when the lights went on. B: Glycated hemoglobin levels in db/db-AL and db/db-IF mice were higher compared with db/m mice; however, IF did not correct glycated hemoglobin levels. Data represent means ± SEM (n = 6–39). *P < 0.05. C: db/db-AL had reduced survival compared with db/m mice. IF improved survival rate of db/db-IF mice compared with that of normal controls. *P < 0.05.
Figure 2
Figure 2
IF reduced DR in db/db mice. AD: Representative images of the trypsin-digested retinas from the four experimental groups: db/m AL (A), db/m IF (B), db/db AL (C), and db/db IF (D). Arrows indicate acellular capillaries. Scale bars: 10 μm. E: Enumeration of acellular capillaries per mm2 retinal area. Data represent means ± SEM (n = 10). *P < 0.05, one-way ANOVA. F: Enumeration of IBA-1+ cells per mm2 retinal area from immunofluorescence-stained retina cryosections. Data represent means ± SEM (n = 3). G: Enumeration of CD45+ cells per mm2 retinal area from immunofluorescence-stained retina cryosections. Data represent means ± SEM (n = 3–5). F and G: *P < 0.05, two-way ANOVA.
Figure 3
Figure 3
IF resulted in distinct changes in the microbiota of db/db mice. AC: β Diversity (presence/absence ordination): Dimensional reduction of the Jaccard distance on presence/absence OTU table, using the PCoA ordination method. A: db/m-AL (green circles) vs. db/db-AL (blue triangles) mice; samples separated along axis 2 according to sample type. B: db/m-AL (green triangles) vs. db/m-IF (feeding, red triangles; fasting, red circles) mice; samples separated along axis 2 according to type, which indicated that samples from IF and AL treatments have different incidences of OTUs. C: db/db-AL (blue triangles) vs. db/db-IF (feeding, purple triangles; fasting, purple circles) mice; samples separated along axis 1 according to type. Samples from db/db-AL mice had a smaller degree of variation in microbiome β diversity than db/db-IF samples. P = 0.001 in all comparisons; n = 5 mice/group. D: Principal component analysis (PCA) of microbiota. Relative abundance of bacteria present in at least 10% of the samples (n = 180) was used. Samples grouped by both disease (spheres, db/m; cubes, db/db) and treatment (blue, AL; red, IF) but less clearly by feeding/fasting within the IF groups. Note that the AL cohorts are closer to each other, whereas the IF cohorts were much further apart, suggesting bigger differences in the microbiomes of db/m-IF and db/db-IF mice. E: Relative proportions of the six most abundant phyla (the aggregate relative abundance for each of the phyla not represented here is less than 0.1). aP < 0.01 vs. db/m-AL; bP < 0.001 vs. db/m-AL; cP < 0.05 vs. db/db-AL; dP < 0.001 vs. db/db-AL; eP < 0.05 vs. db/m IF (feeding); fP < 0.001 vs. db/m IF (feeding); gP < 0.05 vs. db/db IF (fasting). All OTUs (detected in at least 10% of the samples) from all samples per each group were used, irrespective of zeitgeber time. p., phylum.
Figure 4
Figure 4
IF effects on microbiome composition at the genus level. A: Genera that show statistically significant changes in db/db-AL vs. db/m-AL mice. B: Genera that were statistically different in db/db-IF vs. db/m-IF mice in the feeding phase. C: Genera that were statistically different in db/db-IF vs. db/m-IF in the fasting phase. Points are OTUs belonging to each respective genus. Features were considered significant if false discovery rate–corrected P value ≤0.05 and the absolute value of log2 fold change ≥1. D–O: Time course of relative bacterial abundances of selected taxa during the 48-h cycle of IF regimen are shown. ZT represents zeitgeber time, i.e., time when the lights went on. Diurnal oscillations in selected taxa and IF effects: o. Clostridiales (D), f. Ruminococcaceae (E), f. Lachnospiraceae (F), g. Lactobacillus (G), g. Bifidobacterium (H), g. Clostridium (I), g. Oscillospira (J), g. Ruminoccocus (K), g. Turicibacter (L), g. Bacteroides (M), g. Akkermansia (N), and g. Allobaculum (O). Data are sums of relative abundance of all OTUs within each genus ± SEM. f., family; g., genus; o., order.
Figure 5
Figure 5
IF treatment affected gut morphology. AD: Periodic acid Schiff (PAS) staining showing mucin-positive goblet cells. Diabetes reduced goblet cell number, but IF prevented this reduction. E: Quantification of goblet-positive cells. Data represent number of goblet cells/villus. *P < 0.05, n = 13–30 villi/group. FI: Hematoxylin and eosin (H&E) staining of colon. The length of villi was reduced significantly with diabetes, but IF restored levels to normal. J: Quantification of the villi length, in pixels. *P < 0.05, n = 17–26 villi/group. KN: Hematoxylin and eosin staining of the muscularis layer. O: Quantification of the muscularis width. Twenty measurements distributed evenly were done on each section, and data represent averages per section in pixels ± SD; n = 4–7 sections/group. In all cases, one section per mouse was analyzed. Scale bars: 50 μm. P: Peptidoglycan, a component of bacterial cell wall, was measured in plasma from the cohorts using ELISA. Data represent means ± SD (n = 3–5). *P < 0.05, two-way ANOVA.
Figure 6
Figure 6
IF enhanced BA metabolism with increases in the neuroprotective BA TUCDA. Analysis of plasma samples for BA metabolites cholate (A), deoxycholate (B), TUDCA (C), and TCDCA (D). TCDCA and TUDCA were significantly increased with IF diet in the db/db-IF mice. TCDCA is converted to TUDCA by the actions of both 7α- and 7β-HSDH. Values for each sample are normalized by sample volume/utilized for extraction. Each biochemical is then scaled to set the median equal to 1. Missing values are imputed with the minimum. Data represent means ± SD (n = 4–6). *P < 0.05, two-way ANOVA.
Figure 7
Figure 7
TGR5 activation using the BA agonist INT-767 prevented DR. A: TGR5 immunofluorescence staining is located in the retinal ganglion cell layer of a db/m control mouse. NeuN is used as a marker of ganglion cells. TGR5: green, NeuN: red, and DAPI: blue. INL, inner nuclear layer; GCL, ganglion cell layer; ONL, outer nuclear layer. BE: TGR5 and NeuN staining in db/m-AL (B), db/m-IF (C), db/db-AL (D), and db/db-IF (E). F: Quantification of the fluorescence intensity of TGR5 in the retinal ganglion cell layer. Data represent means ± SD (n = 10–12). G: TGR5 mRNA expression in retinas from all cohorts. Data represent means ± SD (n = 5–7). H: TNF-α mRNA expression in retinas from all cohorts. Data represent means ± SD (n = 4–5). *P < 0.05, two-way ANOVA. IL: Effects of INT-767 on retinas of 20-week STZ-diabetic DBA/2J mice. I: INT-767 protects from development of DR as measured by enumeration of acellular capillaries. J: INT-767 returns CD45+ cell numbers to levels seen in no diabetic mice. K: Inflammatory monocytes are reduced in the INT-767–treated mice, as shown by quantification of CD11b+ cells. L: INT-767 reduced numbers of IBA-1+ cells within the retina. C, DBA/2J mice fed with vehicle; C+INT, DBA/2J mice fed with INT-767; D, STZ/WD mice; D+INT, STZ/WD with INT-767. Data represent means ± SD (n = 6 per group). *P < 0.05, one-way ANOVA.
Figure 8
Figure 8
A model for IF-induced changes in the microbiome and their potential impact on development of DR. In diabetic mice, IF resulted in significant expansion of bacteria of the Firmicutes phylum that metabolize primary BAs to secondary BAs, such as TUDCA. TUDCA then enters the circulation and crosses the blood-retina barrier, targets its receptor, TGR5, in the ganglion cell layer and protects against retinal neurodegeneration and inflammation.

Comment in

References

    1. Zhang X, Saaddine JB, Chou CF, et al. Prevalence of diabetic retinopathy in the United States, 2005-2008. JAMA 2010;304:649–656 - PMC - PubMed
    1. Antonetti DA, Klein R, Gardner TW. Diabetic retinopathy. N Engl J Med 2012;366:1227–1239 - PubMed
    1. Gardner TW, Davila JR. The neurovascular unit and the pathophysiologic basis of diabetic retinopathy. Graefes Arch Clin Exp Ophthalmol 2017;255:1–6 - PMC - PubMed
    1. Stewart MW. Treatment of diabetic retinopathy: Recent advances and unresolved challenges. World J Diabetes 2016;7:333–341 - PMC - PubMed
    1. Fairburn CG, Harrison PJ. Eating disorders. Lancet 2003;361:407–416 - PubMed

Publication types

MeSH terms

Substances