. 2018 Jun 15;200(12):4180-4189.
doi: 10.4049/jimmunol.1800241. Epub 2018 Apr 30.

Chronic Lymphocytic Leukemia-Derived IL-10 Suppresses Antitumor Immunity

Affiliations

Chronic Lymphocytic Leukemia-Derived IL-10 Suppresses Antitumor Immunity

Sara S Alhakeem et al. J Immunol. .

Abstract

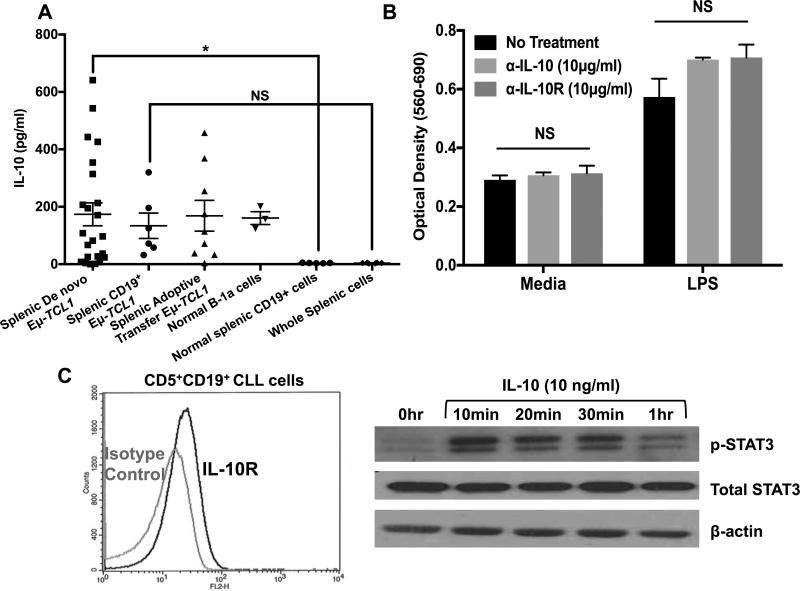
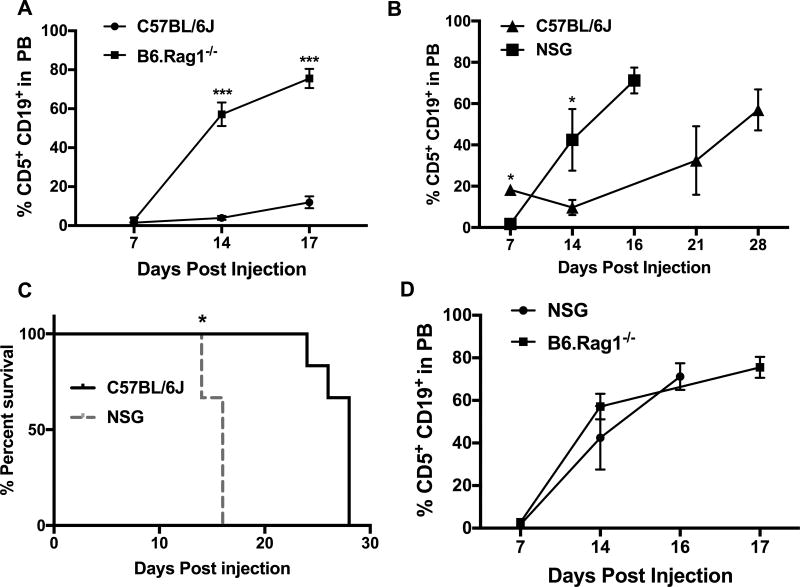
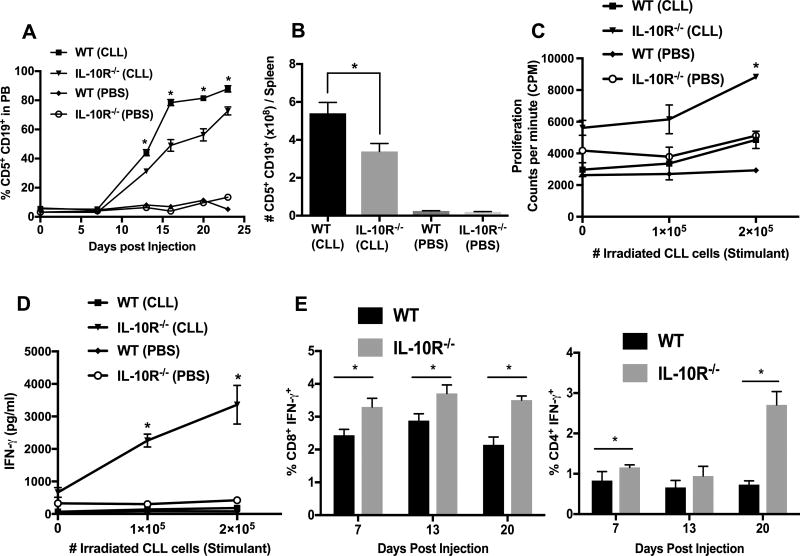
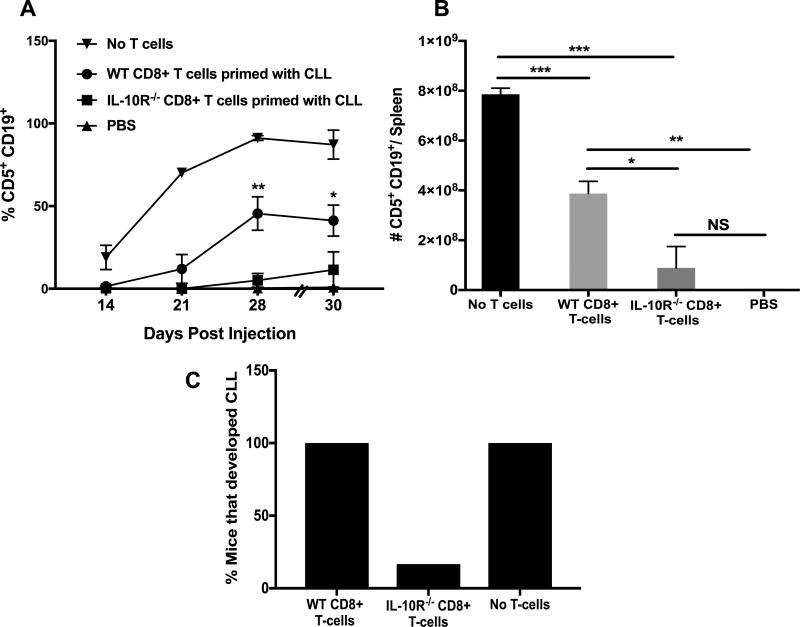
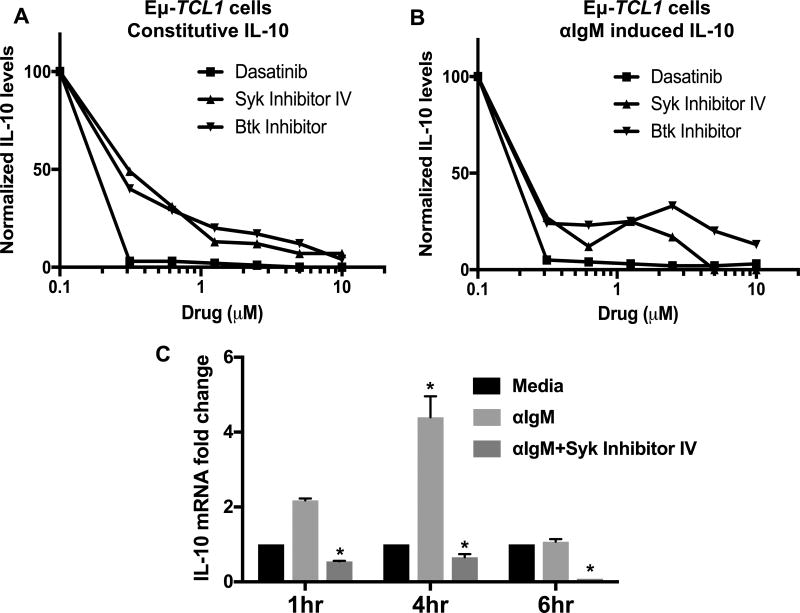
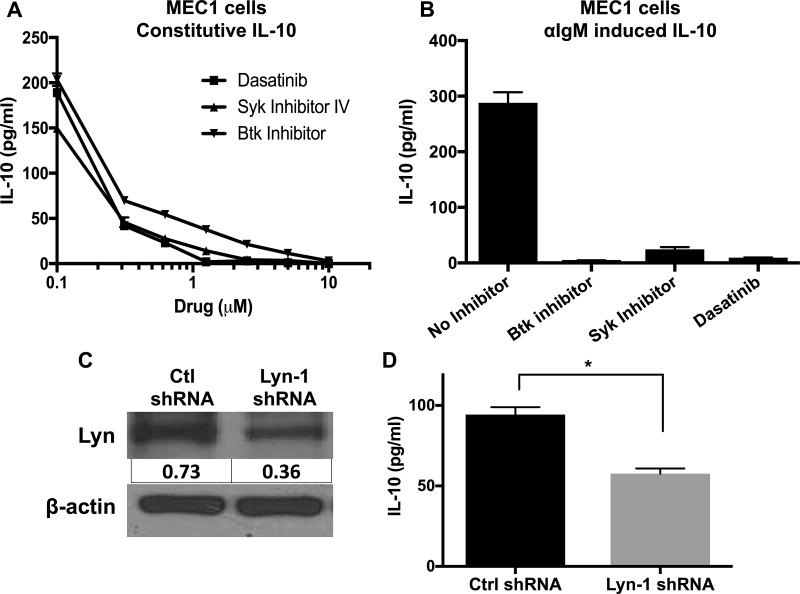
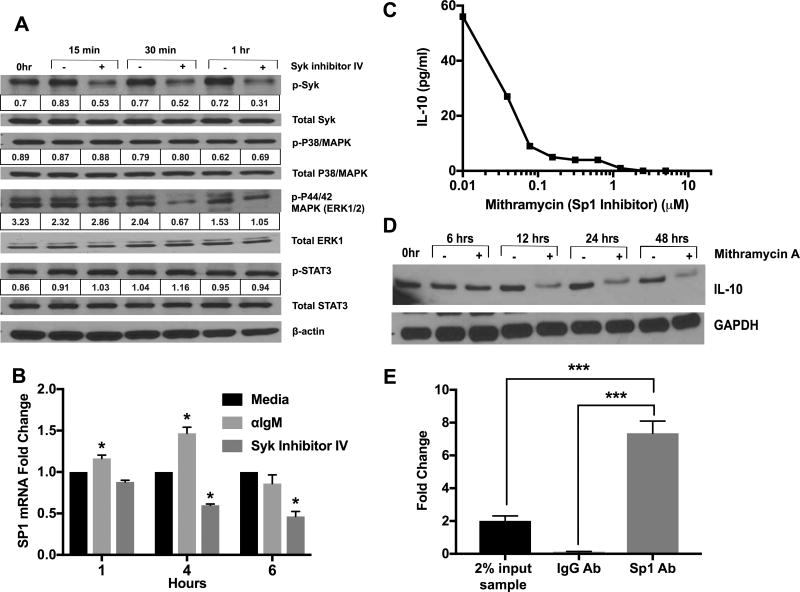
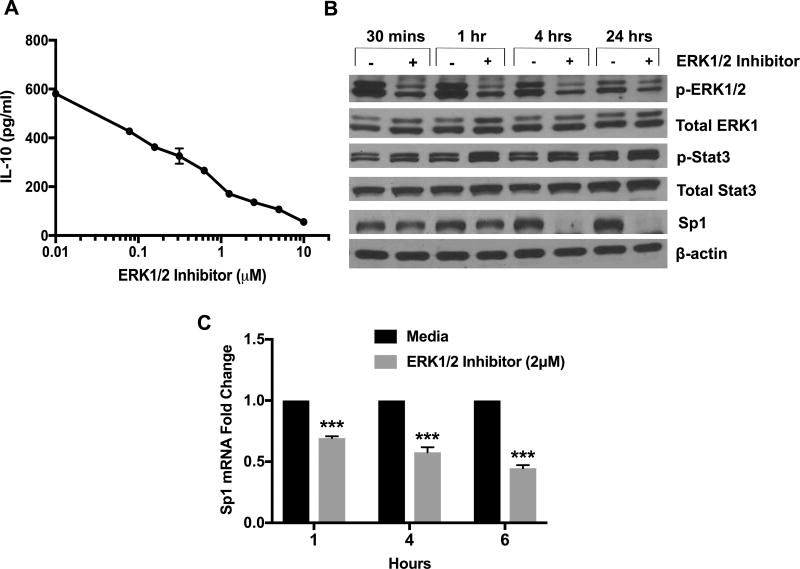
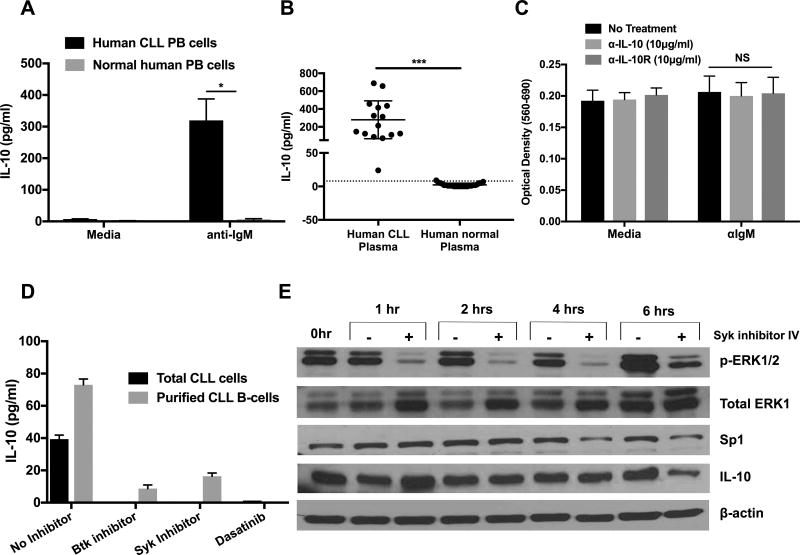
Chronic lymphocytic leukemia (CLL) patients progressively develop an immunosuppressive state. CLL patients have more plasma IL-10, an anti-inflammatory cytokine, than healthy controls. In vitro human CLL cells produce IL-10 in response to BCR cross-linking. We used the transgenic Eμ-T cell leukemia oncogene-1 (TCL1) mouse CLL model to study the role of IL-10 in CLL associated immunosuppression. Eμ-TCL mice spontaneously develop CLL because of a B cell-specific expression of the oncogene, TCL1. Eμ-TCL1 mouse CLL cells constitutively produce IL-10, which is further enhanced by BCR cross-linking, CLL-derived IL-10 did not directly affect survival of murine or human CLL cells in vitro. We tested the hypothesis that the CLL-derived IL-10 has a critical role in CLL disease in part by suppressing the host immune response to the CLL cells. In IL-10R-/- mice, wherein the host immune cells are unresponsive to IL-10-mediated suppressive effects, there was a significant reduction in CLL cell growth compared with wild type mice. IL-10 reduced the generation of effector CD4 and CD8 T cells. We also found that activation of BCR signaling regulated the production of IL-10 by both murine and human CLL cells. We identified the transcription factor, Sp1, as a novel regulator of IL-10 production by CLL cells and that it is regulated by BCR signaling via the Syk/MAPK pathway. Our results suggest that incorporation of IL-10 blocking agents may enhance current therapeutic regimens for CLL by potentiating host antitumor immune response.


Figures

Figure 1
Figure 1. Constitutive IL-10 production by CLL cells and its role in CLL cell survival
A) CLL cells were harvested from spleens of Eµ-TCL1 (n=23) or adoptive transfer mice (n=9). B-1a cells were isolated from the peritoneal cavity (PC) (n=3) and normal CD19+ cells were isolated from spleens of C57BL/6J mice (n=5). Purified CD19+ Eµ-TCL1 cells were cultured for 24 hours and IL-10 was measured in the supernatants by ELISA. Bars represent mean±SE. B) Splenic Eµ-TCL1 cells were cultured with αIL-10 or αIL-10R antibodies ±LPS (5µg/ml) for 48 hours. Survival was measured by MTT. Values represent mean±SD of triplicate cultures. C) Flow cytometric analysis of IL-10R expression by Eµ-TCL1 cells (left) and protein lysates of Eµ-TCL1 CLL cells stimulated with exogenous IL-10 were analyzed for STAT3 activation by immunoblot (right). β-actin is used for loading control. *p< 0.05, NS; not significant.
Figure 2
Figure 2. Lack of B, T and NK cells leads to an acceleration of CLL growth kinetics
A–D) Eµ-TCL1 cells (4×10⁶) were adoptively transferred into WT, B6.Rag1−/− or NSG mice by retro-orbital injection. Leukemic status is determined by weekly submandibular bleeding. Graph shows the % CD5+CD19+ cells in the peripheral blood at indicated time points (A, B and D). Kaplan-Meier blot represents the survival of C57BL/6J and NSG mice during the course of the experiment (n=6) (C). * p< 0.05, *** p< 0.001 determined by Student’s t-test for panels A, B and D and by Log-rank (Mantel-Cox) test for panel C. Similar results were obtained in another experiment.
Figure 3
Figure 3. CLL cell growth is reduced and T-cell function is enhanced in IL-10R−/− mice
A–B) Eµ-TCL1 CLL cells (4×10⁶) were intravenously transferred into WT and IL-10R−/− mice (n=5). Leukemia status was monitored by weekly bleeding and is shown as CD5+CD19+ cells after gating on CD45+ cells in PB (A) and tumor burden was expressed as total number of CD5+CD19+ cells per spleen (B). Values represent arithmetic mean±SD (n=5). C–D) Magnetic bead purified CD8+ cells (105) from WT and IL-10R−/− mice 20-days-post CLL injection were cultured with irradiated CLL cells for 72 hours. Proliferation, measured by 3[H] incorporation (C), and IFN-γ secretion by CD8+ T-cells (D) are shown. Values represent mean±SD of triplicate cultures. E) Intracellular staining of IFN-γ was performed after 4 hours of stimulation with PMA and Ionomycin. Levels of cytoplasmic IFN-γ+ CD8+(left) and CD4+(right) T-cells from WT and IL-10R−/− mice at different times post-CLL injection. Values represent arithmetic mean±SE (n=4). *p< 0.05 comparing wild type and IL-10R−/− groups.
Figure 4
Figure 4. Adoptive transfer of CLL primed CD8+ T cells effectively delayed CLL growth
A) Purified CD8+ cells from WT and IL-10R−/− mice primed with CLL cells 14-days before were injected into NSG mice along with CLL cells at a T-cell:CLL ratio of 1:32. Leukemic status was monitored by CD5+CD19+ cell accumulation in PB. Values represent mean±SE (n=6). B) CD5+CD19+ cell numbers in the spleens of recipients at the time of euthanization. C) Percentage of mice that developed CLL from each group. *p< 0.05, p**< 0.01, p***< 0.001, NS; not significant comparing disease in recipients of wild type and IL-10R−/− CD8+ T cells.
Figure 5
Figure 5. The role of BCR signaling in IL-10 production by Eµ TCL1 CLL cells
A–B) Eµ-TCL1 cells were cultured without (A) or with (B) αIgM ±indicated doses of dasatinib (an SFK inhibitor), Syk inhibitor-IV or Btk inhibitor (Ibrutinib). IL-10 levels in supernatants were measured after 24 hours (at which time the cell viability was 75–80%). Values are normalized to the no drug control. IL-10 range for untreated Eµ-TCL1 cells is 193–349pg/ml. C) IL-10 mRNA levels (normalized to mouse 18S RNA) are determined by qRT-PCR in Eµ-TCL1 CLL cells treated with or without αIgM ±Syk inhibitor-IV. Values represent mean±SD of triplicates. Results are representative of 3–8 experiments. *p< 0.05 comparing untreated to αIgM±Syk inhibitor treated cells.
Figure 6
Figure 6. The role of BCR signaling in IL-10 production by MEC1 cells
A) MEC1 cells were cultured without (A) or with (B) αIgM ± dasatinib, Syk inhibitor-IV or Btk inhibitor. IL-10 levels in supernatants were measured after 24 hours. For (B) 2µM of indicated drugs is used. C) Immunoblot showing a reduction in Lyn in MEC1 cells expressing Lyn specific shRNA. Lyn protein values were normalized to β-actin. D) IL-10 levels were measured in the supernatants of MEC1 cells expressing either control or Lyn shRNA. Values represent mean±SD of triplicates. Results are representative of 2–5 experiments. *p< 0.05.
Figure 7
Figure 7. IL-10 production by Eµ TCL1 CLL cells is dependent on ERK1/2 MAPK and the transcription factor Sp1 but not on p38MAPK or STAT3
A) Eµ-TCL1 cells were treated with Syk inhibitor-IV (5µM) for indicated time periods. Levels of key molecules downstream of BCR signaling were quantified by Immunoblotting. Band densitometry analysis was performed using the NIH ImageJ program. Phospho-protein levels were normalized to total protein. Results are representative of three experiments. B) Sp1 mRNA levels were quantified by qRT-PCR after treatment of Eµ-TCL1 cells with αIgM ±Syk inhibitor-IV. Fold change was normalized to the no-treatment group. Values represent mean±SD of triplicate determinations. C) Eµ-TCL1 cells were treated with various doses of mithramycin A for 24 hours and IL-10 in the supernatant was quantified by ELISA. D) Immunoblot analysis of IL-10 protein levels in CLL cells after treatment with mithramycin A (5µM). E) ChIP with anti-Sp1 or control IgG was carried out as described in the Methods. qRT-PCR was performed on the ChIP DNA product using primers specific for the consensus Sp1 binding site sequence in the IL-10 promoter. Results are calculated using the Fold Enrichment Method. *p< 0.05, ***p<0.001 comparing untreated to αIgM±Syk inhibitor treated cells.
Figure 8
Figure 8. Effect of ERK1/2 inhibition on Sp1 and IL-10 levels
Eµ-TCL1 CLL cells were cultured with the ERK1/2 inhibitor (SCH772984) (2µM). A) IL-10 levels in 24-hour supernatants were measured by ELISA. Values represent mean±SD of triplicates. B) Levels of p-ERK1/2, total ERK1, p-STAT3, total STAT3 and Sp1 were quantified by immunoblot analysis. Results are representative of three experiments. C) Sp1 mRNA levels were quantified by qRT-PCR. Fold change was normalized to the no-treatment group. Values represent mean±SD of triplicates ***p<0.001 comparing groups with and without ERK1/2 inhibitor.
Figure 9
Figure 9. Human CLL cells utilize BCR signaling for IL-10 production
A–B) IL-10 levels in 24-hour supernatants of human CLL cells ±αIgM (A) or in the plasma of human CLL patients (n=15) and normal donors (n=28) (B). C) Human CLL cells were cultured with αIL-10 or αIL-10R antibodies ±αIgM for 48 hours. Survival of CLL cells was measured by MTT. D) Human total CLL cells or purified CLL B-cells were stimulated with αIgM±inhibitors of Btk, Syk, SFK or ERK1/2 for 24 hours (2µM). IL-10 levels in the supernatants were measured by ELISA. Human B-cell CLL cells were purified by negative selection (MojoSort Human B cells (CD43) Isolation Kit from Biolegend. E) Human CLL cells were treated with Syk inhibitor-IV (2µM). Protein levels indicated were quantified by immunoblot analysis. For (A, C and D), values represent mean±SD of triplicate cultures. *p< 0.05, ***p< 0.0001, NS; not significant.

References

    1. Chiorazzi N, Rai KR, Ferrarini M. Chronic lymphocytic leukemia. N Engl J Med. 2005;352:804–815. - PubMed
    1. Hayakawa K, Formica AM, Brill-Dashoff J, Shinton SA, Ichikawa D, Zhou Y, Morse HC, 3rd, Hardy RR. Early generated B1 B cells with restricted BCRs become chronic lymphocytic leukemia with continued c-Myc and low Bmf expression. J Exp Med. 2016;213:3007–3024. - PMC - PubMed
    1. Hayakawa K, Formica AM, Colombo MJ, Ichikawa D, Shinton SA, Brill-Dashoff J, Hardy RR. B cells generated by B-1 development can progress to chronic lymphocytic leukemia. Ann N Y Acad Sci. 2015;1362:250–255. - PubMed
    1. Morrison VA. Infectious complications of chronic lymphocytic leukaemia: pathogenesis, spectrum of infection, preventive approaches. Best Pract Res Clin Haematol. 2010;23:145–153. - PubMed
    1. Nosari A. Infectious complications in chronic lymphocytic leukemia. Mediterr J Hematol Infect Dis. 2012;4:e2012070. - PMC - PubMed

Publication types