. 2018 May 15;115(20):5193-5198.
doi: 10.1073/pnas.1719291115. Epub 2018 Apr 30.

Habitat degradation negatively affects auditory settlement behavior of coral reef fishes

Affiliations

Habitat degradation negatively affects auditory settlement behavior of coral reef fishes

Timothy A C Gordon et al. Proc Natl Acad Sci U S A. .

Abstract

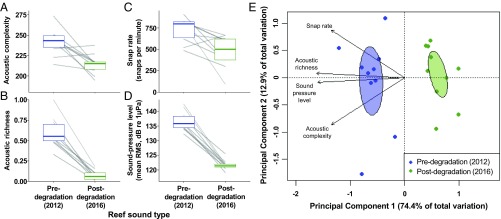
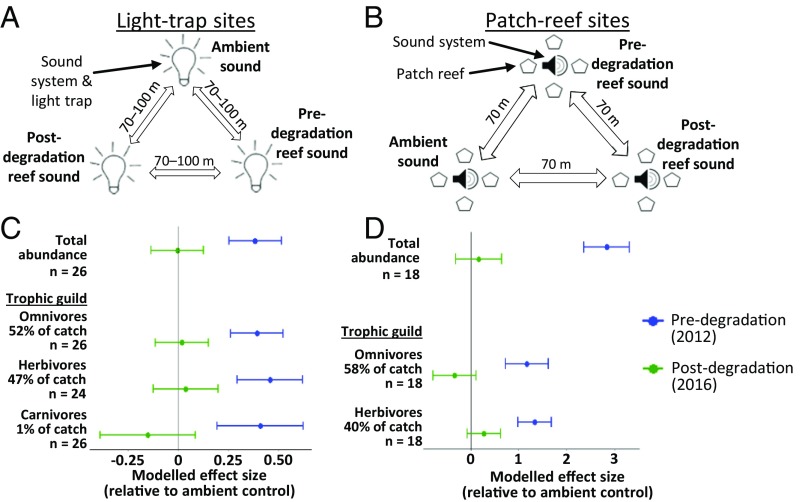
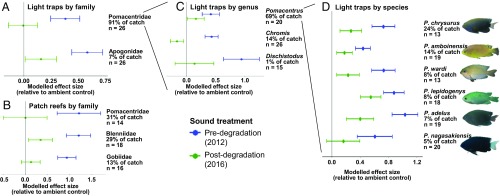
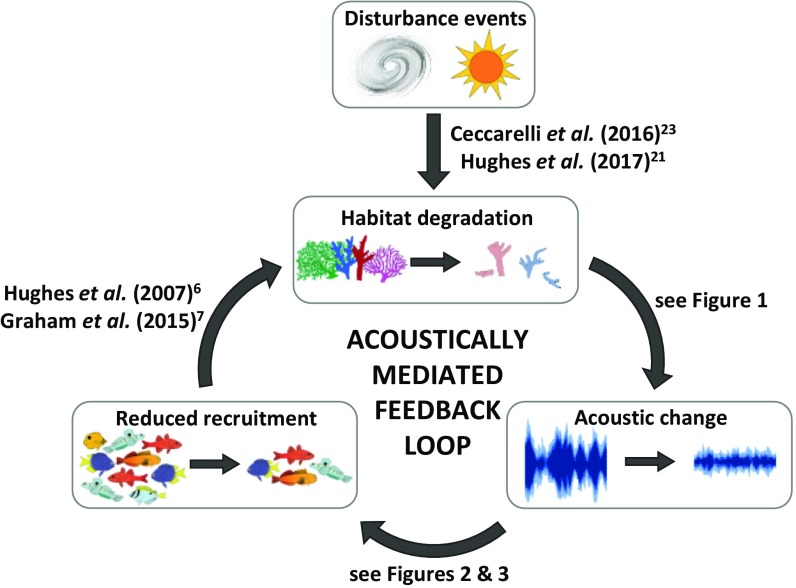
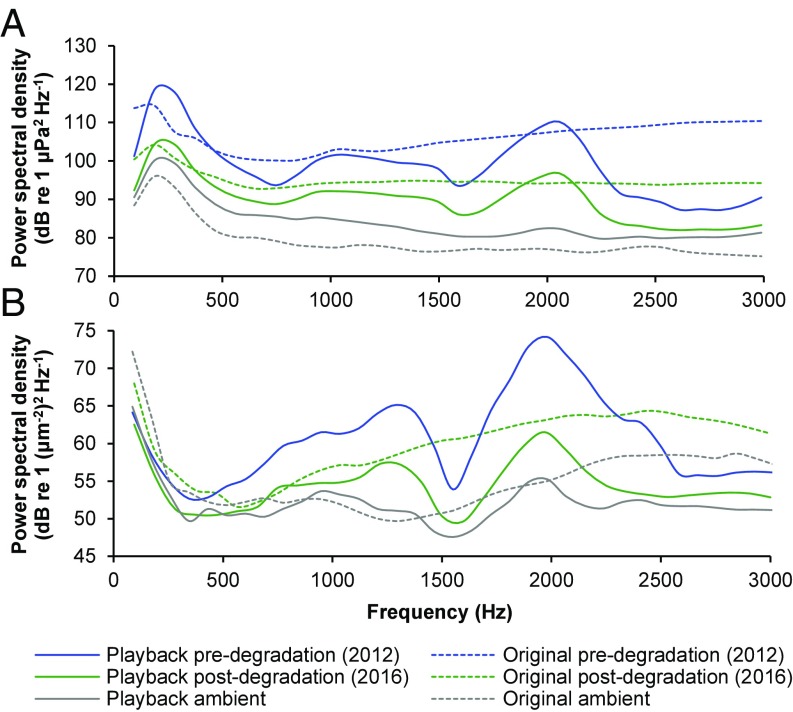
Coral reefs are increasingly degraded by climate-induced bleaching and storm damage. Reef recovery relies on recruitment of young fishes for the replenishment of functionally important taxa. Acoustic cues guide the orientation, habitat selection, and settlement of many fishes, but these processes may be impaired if degradation alters reef soundscapes. Here, we report spatiotemporally matched evidence of soundscapes altered by degradation from recordings taken before and after recent severe damage on Australia's Great Barrier Reef. Postdegradation soundscapes were an average of 15 dB re 1 µPa quieter and had significantly reduced acoustic complexity, richness, and rates of invertebrate snaps compared with their predegradation equivalents. We then used these matched recordings in complementary light-trap and patch-reef experiments to assess responses of wild fish larvae under natural conditions. We show that postdegradation soundscapes were 8% less attractive to presettlement larvae and resulted in 40% less settlement of juvenile fishes than predegradation soundscapes; postdegradation soundscapes were no more attractive than open-ocean sound. However, our experimental design does not allow an estimate of how much attraction and settlement to isolated postdegradation soundscapes might change compared with isolated predegradation soundscapes. Reductions in attraction and settlement were qualitatively similar across and within all trophic guilds and taxonomic groups analyzed. These patterns may lead to declines in fish populations, exacerbating degradation. Acoustic changes might therefore trigger a feedback loop that could impair reef resilience. To understand fully the recovery potential of coral reefs, we must learn to listen.

Keywords: Great Barrier Reef; acoustics; climate change; coral reefs; settlement.


Conflict of interest statement

The authors declare no conflict of interest.

Figures

Fig. 1.
Fig. 1.
Acoustic analysis of pre- and postdegradation nocturnal reef soundscapes. (A) Acoustic complexity index, (B) acoustic richness, (C) invertebrate snap rate, and (D) sound-pressure level calculated from 30-s site-matched recordings (FFT size = 512) of nocturnal reef noise taken in November 2012 (predegradation) and November 2016 (postdegradation) (n = 10). Shown are results for each reef (gray lines) and overall median and 25% and 75% quartiles (colored boxes). (E) Principal Component Analysis based on a correlation matrix of the four ecoacoustic indices from site-matched pre- and postdegradation soundscapes. Areas of ellipses represent SEs of associated points.
Fig. 2.
Fig. 2.
Effects of sound treatment on abundance of recruiting reef fish. (A and B) Experimental setup at (A) light-trap and (B) patch-reef sites; traps and reefs were location-fixed, and sound treatments were rotated in a randomized counterbalanced block design. (C and D) Modeled effects of pre- and postdegradation reef-sound playback on abundance of fish collected from (C) light traps and (D) patch reefs, relative to an ambient-sound control. Shown are results for models analyzing total abundance and all trophic guilds with at least 50% frequency of occurrence. Each row represents a separate model; in each case, the y axis represents the baseline abundance associated with ambient controls. Points represent relative effect sizes associated with the fixed effect of sound treatment; error bars represent associated SEs. Total abundance of each trophic guild as a percentage of the experiment’s total catch and the number of experimental replicates analyzed (n) are given on the y axis. Results come from Generalized Linear Mixed Models and Linear Mixed Models, which all display statistically significant effects of sound treatment (P < 0.05; see Tables S1 and S2). For details of trophic guild classifications, see Dataset S1.
Fig. 3.
Fig. 3.
Effects of sound treatment at different taxonomic levels. Modeled effects of pre- and postdegradation reef-sound playback, relative to an ambient-sound control, on abundance of fishes in taxonomic groups with at least 50% frequency of occurrence. Shown are (A) families in light traps, (B) families on patch reefs, (C) genera in light traps, and (D) species in light traps, with total abundance as a percentage of the experiment’s total catch and number of replicates analyzed (n) given on the y axis. Each row represents a separate model; in each case, the y axis represents the baseline abundance associated with ambient controls. Points represent relative-effect sizes associated with the fixed effect of sound treatment; error bars are associated SEs. Results come from Generalized Linear Mixed Models and Linear Mixed Models that calculated statistically significant effects of the sound treatment (P < 0.05; see Tables S1 and S2). Images courtesy of Andy Lewis and Mark Shepherd (Life Island Field Guide, Sydney).
Fig. 4.
Fig. 4.
Schematic illustrating the potential for an acoustically mediated feedback loop that impairs reef recovery. Disturbance-induced habitat degradation causes acoustic change on reefs. This might reduce recruitment, further exacerbating degradation as a reduction in grazing facilitates macroalgal dominance. Evidence for each step provided on relevant arrows; pictures of fish adapted from ref. .
Fig. 5.
Fig. 5.
Power spectral density of original and played-back sound recordings. Mean spectral content in (A) sound-pressure and (B) particle-motion domains of all original field recordings of reef noise and ambient conditions (dashed lines) and playback of those recordings at experimental sites (solid lines). Thirty-second sections of all five triplicate sets of recordings were combined and analyzed across 0–3,000 Hz as the likely hearing range of many coral reef fish larvae (50, 51) (spectrum level units averaged, Hamming window function, FFT length = 512). Predegradation (2012) field recordings were taken only in the sound-pressure domain.

References

    1. Spalding MD, Brown BE. Warm-water coral reefs and climate change. Science. 2015;350:769–771. - PubMed
    1. Hughes TP, et al. Coral reefs in the Anthropocene. Nature. 2017;546:82–90. - PubMed
    1. Hughes TP, et al. Spatial and temporal patterns of mass bleaching of corals in the Anthropocene. Science. 2018;359:80–83. - PubMed
    1. Hughes TP, Graham NAJ, Jackson JBC, Mumby PJ, Steneck RS. Rising to the challenge of sustaining coral reef resilience. Trends Ecol Evol. 2010;25:633–642. - PubMed
    1. Roff G, et al. Phase shift facilitation following cyclone disturbance on coral reefs. Oecologia. 2015;178:1193–1203. - PubMed

Publication types

LinkOut - more resources