. 2018 May 15;115(20):5265-5270.
doi: 10.1073/pnas.1715590115. Epub 2018 Apr 30.

Revealing the specificity of regulatory T cells in murine autoimmune diabetes

Affiliations

Revealing the specificity of regulatory T cells in murine autoimmune diabetes

Allyson Spence et al. Proc Natl Acad Sci U S A. .

Erratum in

Abstract

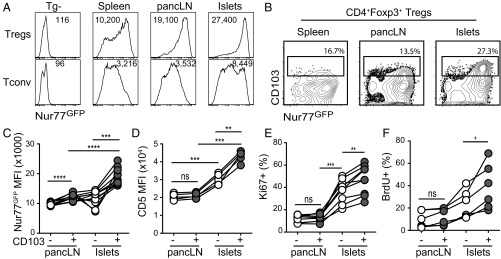
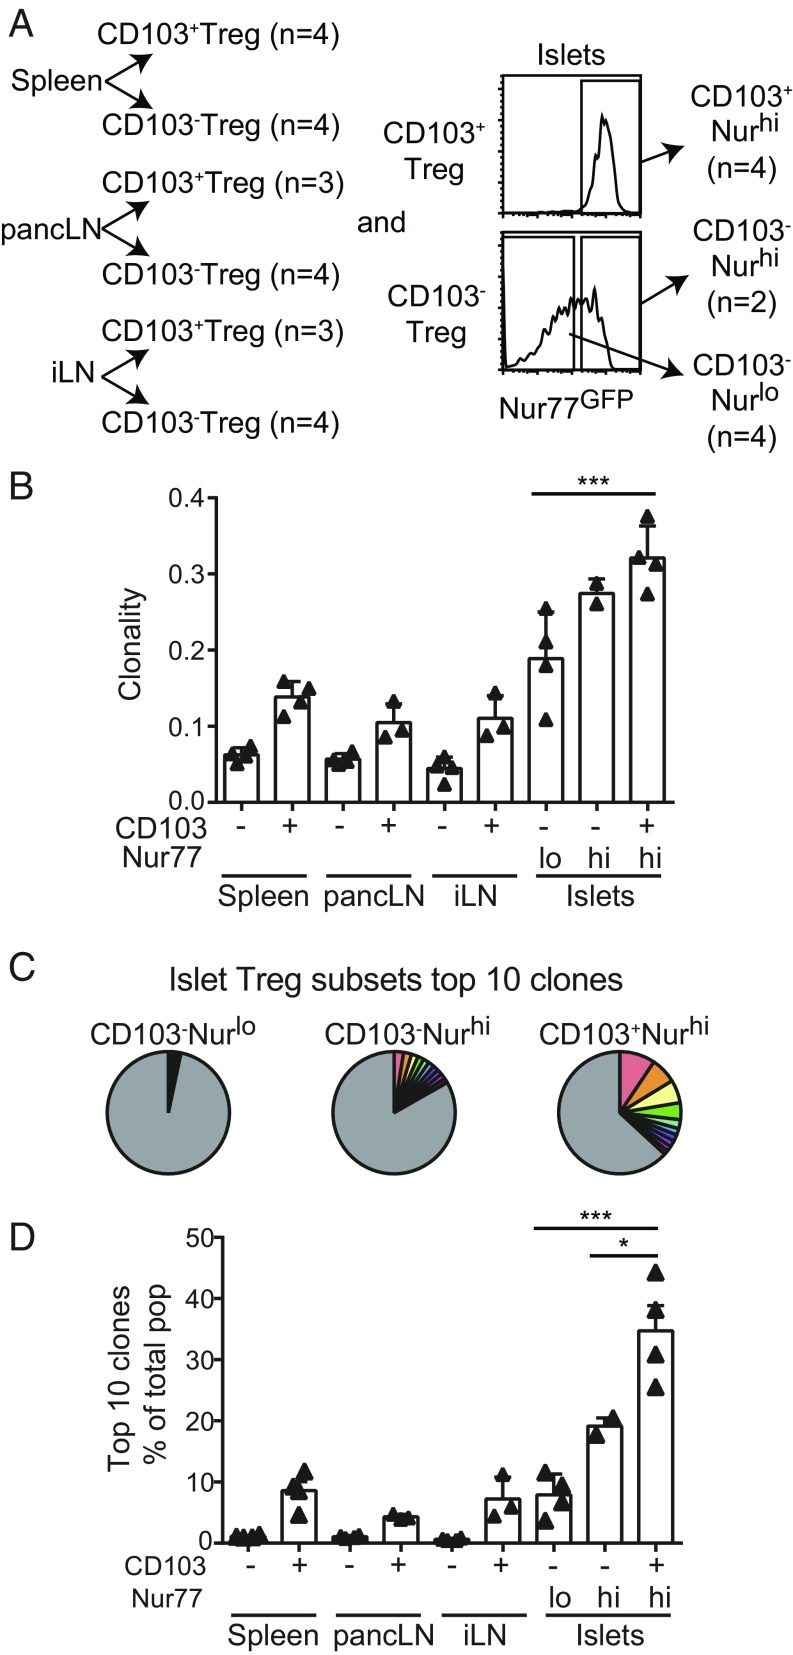
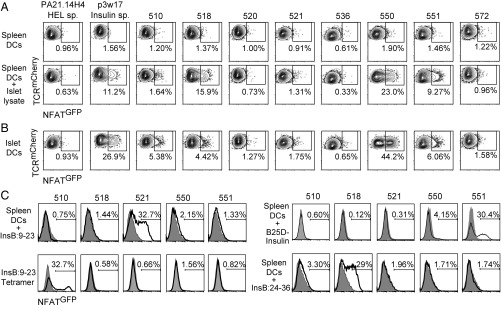
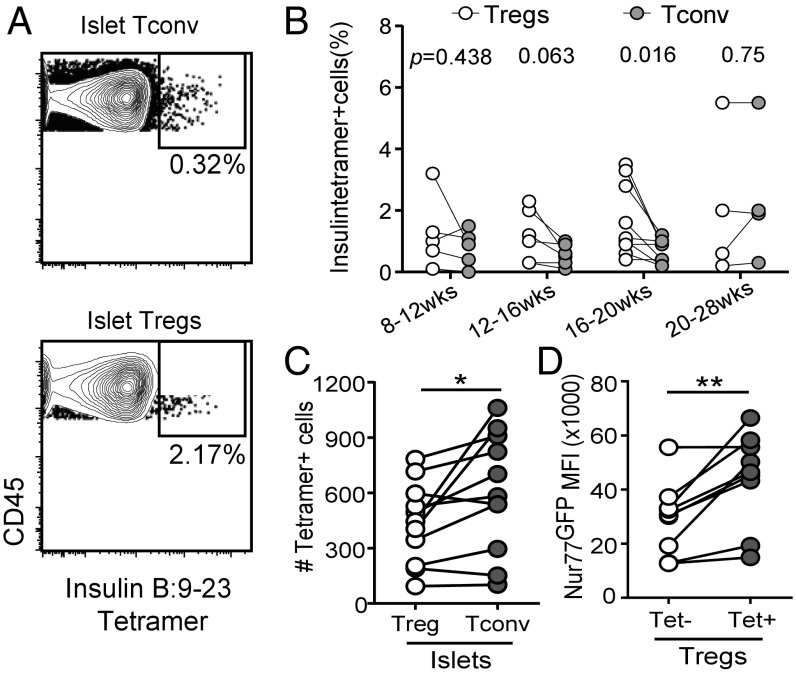
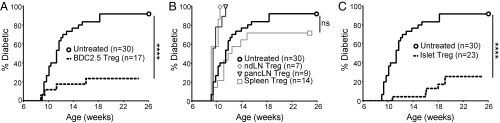
Regulatory T cells (Tregs) control organ-specific autoimmunity in a tissue antigen-specific manner, yet little is known about their specificity in a natural repertoire. In this study, we used the nonobese diabetic (NOD) mouse model of autoimmune diabetes to investigate the antigen specificity of Tregs present in the inflamed tissue, the islets of Langerhans. Compared with Tregs present in spleen and lymph node, Tregs in the islets showed evidence of antigen stimulation that correlated with higher proliferation and expression of activation markers CD103, ICOS, and TIGIT. T cell receptor (TCR) repertoire profiling demonstrated that islet Treg clonotypes are expanded in the islets, suggesting localized antigen-driven expansion in inflamed islets. To determine their specificity, we captured TCRαβ pairs from islet Tregs using single-cell TCR sequencing and found direct evidence that some of these TCRs were specific for islet-derived antigens including insulin B:9-23 and proinsulin. Consistently, insulin B:9-23 tetramers readily detected insulin-specific Tregs in the islets of NOD mice. Lastly, islet Tregs from prediabetic NOD mice were effective at preventing diabetes in Treg-deficient NOD.CD28-/- recipients. These results provide a glimpse into the specificities of Tregs in a natural repertoire that are crucial for opposing the progression of autoimmune diabetes.

Keywords: T cell receptor; TCR sequencing; antigen specificity; regulatory T cells; type 1 diabetes.


Figures

Fig. 1.
Fig. 1.
Evidence of antigen exposure at the site of inflammation. (A) Representative histograms of flow cytometric analysis of Nur77GFP expression in CD4+Foxp3+ Tregs and CD4+Foxp3 Tconv cells from prediabetic NOD mice. Results represent at least 80 mice analyzed in more than 20 independent experiments. (B) Representative contour plots of CD103 and Nur77GFP expression by Tregs from prediabetic NOD mice. Results represent at least 80 mice analyzed in more than 20 independent experiments. (C) Quantification of Nur77GFP in CD103+ or CD103 Tregs in B. Results shown are a summary of three independent experiments. Statistical significance was determined using a repeated measures one-way ANOVA followed by Tukey’s multiple comparison test; ***P < 0.001; ****P < 0.0001. (D) CD5 MFI in CD103+ or CD103 Tregs from prediabetic NOD mice. Results shown are a summary of two independent experiments. Statistical significance was determined using a repeated measures one-way ANOVA followed by Tukey’s multiple comparison test; **P < 0.01; ***P < 0.001; ns, not significant. (E) Ki67 staining in CD103+ or CD103 Tregs from prediabetic NOD mice. Results shown are a summary of three independent experiments. Statistical significance was determined using a repeated measures one-way ANOVA followed by Tukey’s multiple comparison test; **P < 0.01; ***P < 0.001; ns, not significant. (F) BrdU staining in CD103+ or CD103 Tregs from prediabetic NOD mice. BrdU was administered continuously for 1 wk before analysis. Results shown are a summary of two independent experiments. Statistical significance was determined using a paired t test; *P < 0.05; ns, not significant.
Fig. 2.
Fig. 2.
Treg TCR repertoires in prediabetic NOD mice. (A) A summary of Treg populations used for TCRβ chain sequencing analysis. CD103+ and CD103 Treg populations were sorted from spleen, pancLN, and iLN. Islet Tregs were additionally sorted on Nur77GFP expression from islets: CD103+Nurhi, CD103Nurhi, and CD103Nurlo. A total of 32 populations from four mice were analyzed individually (SI Appendix, Table S1). (B) Clonality of each Treg population’s TCR repertoire. Each triangle represents a single mouse, and the columns represent the mean and SD of the group. Statistical significance was determined using a one-way ANOVA followed by Tukey’s multiple comparison test; ***P < 0.001. (C) Frequency of the 10 most abundant clones in different islet Treg populations in a representative mouse. (D) Summary graph of the sum frequencies of the 10 most abundant clones in different Treg populations in each mouse. Each triangle represents a single mouse, and the columns represent the mean and SD of the group. Statistical significance determined as described in B; *P < 0.01.
Fig. 3.
Fig. 3.
Islet antigen reactivity of activated islet Tregs. (A) Hybridomas expressing NFATGFP reporter and TCRs derived from activated islet Tregs were stimulated for 20 to 24 h with splenic DCs or splenic DCs with islet lysates. GFP expression was determined using flow cytometry, and contour plots for all of the hybridomas analyzed are shown. (B) As described in A, except the hybridomas were stimulated with islet DCs. (C) As described in A, except the hybridomas were stimulated with splenic DCs with insulin B:9–23 peptide, plate-bound insulin tetramers p8E and p8G, human B25D-insulin, or proinsulin B:24–36 peptide. Filled histograms are the HEL-specific hybridoma; open histograms are the TCR hybridoma listed at the top of the column. In AC, representative flow plots for at least two independent experiments are shown.
Fig. 4.
Fig. 4.
Insulin-specific Tregs in NOD mice. (A) Representative contour plots of pooled insulin B:9–23 tetramers p8G and p8E staining versus control HEL tetramer staining in islet Tconv cells (Upper) and Tregs (Lower). Cells were gated as live CD45+Thy1.1+CD8 and Foxp3+ (Tregs) or Foxp3 (Tconv cells). Results are representative of at least eight mice analyzed in three independent experiments. (B) Quantification of insulin tetramer staining in islet Tconv cells and Tregs. Each pair of connected circles represents one mouse, and the mice (n = 24) are grouped according to age. Results shown are a summary of six independent experiments. Statistical significance was determined using a paired Student’s t test, and P values are listed at the top of the groups. (C) Total number of insulin tetramer-positive Tregs and Tconv cells from islets. Results shown are a summary of three independent experiments. Statistical significance was determined using a paired Student’s t test; *P < 0.05. (D) Nur77GFP MFI of insulin tetramer-positive and -negative Tregs in islets. Results shown are a summary of three independent experiments. Statistical significance was determined using a paired Student’s t test; **P < 0.001.
Fig. 5.
Fig. 5.
In vivo function of islet Tregs. (A) CD28−/− mice between 2 and 3 wk of age were treated with 50,000 BDC-2.5 TCR transgenic Tregs sorted from nonpancreas draining LN (dashed line, n = 17) or untreated (bold solid line, n = 30). Diabetes development was monitored until the mice were 25 wk of age or until diabetes development. Statistical significance was determined using the log-rank (Mantel–Cox) test; ****P < 0.0001. (B) Same as in A, except polyclonal Tregs sorted from nonpancreas draining LN (ndLN, n = 7), pancLN (n = 9), and spleen (n = 14) of NOD mice were used to treat CD28−/− mice and compared with nontreated controls (bold solid line, n = 30). Statistical significance was determined using the log-rank (Mantel–Cox) test; ns, not significant. (C) Same as in A, except polyclonal Tregs sorted from inflamed islets of NOD mice (dashed line, n = 23) were used to treat CD28−/− mice and compared with nontreated controls (bold solid line, n = 30). Statistical significance was determined using the log-rank (Mantel–Cox) test; ****P < 0.0001. Results in AC are summaries of more than 10 independent experiments performed over a 24-mo period.

References

    1. Tang Q, Bluestone JA. The Foxp3+ regulatory T cell: A jack of all trades, master of regulation. Nat Immunol. 2008;9:239–244. - PMC - PubMed
    1. Fontenot JD, Rudensky AY. A well adapted regulatory contrivance: Regulatory T cell development and the forkhead family transcription factor Foxp3. Nat Immunol. 2005;6:331–337. - PubMed
    1. Hsieh CS, et al. Recognition of the peripheral self by naturally arising CD25+ CD4+ T cell receptors. Immunity. 2004;21:267–277. - PubMed
    1. Jordan MS, et al. Thymic selection of CD4+CD25+ regulatory T cells induced by an agonist self-peptide. Nat Immunol. 2001;2:301–306. - PubMed
    1. Kawahata K, et al. Generation of CD4(+)CD25(+) regulatory T cells from autoreactive T cells simultaneously with their negative selection in the thymus and from nonautoreactive T cells by endogenous TCR expression. J Immunol. 2002;168:4399–4405. - PubMed

Publication types

MeSH terms