

Comment
doi: 10.1073/pnas.1805698115.
Epub 2018 Apr 30.
Adaptive and nonadaptive changes in phenological synchrony
Affiliations
- PMID: 29712854
- PMCID: PMC5960338
- DOI: 10.1073/pnas.1805698115
Item in Clipboard
Comment
Adaptive and nonadaptive changes in phenological synchrony
Proc Natl Acad Sci U S A.
.
No abstract available
Conflict of interest statement
The author declares no conflict of interest.
Figures
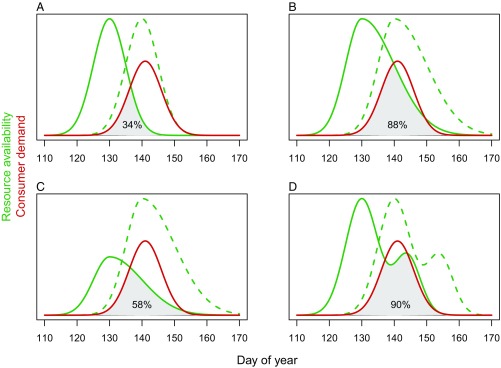
Changes in phenological synchrony, defined as the temporal delay in early or peak phases of occurrence, may have very different effects on consumer–resource systems depending on a number of other features of the full phenological distributions. In the illustrated examples, the original phenology of resource availability (green dashed line; peak at day 140) has advanced with 10 d (green solid line; peak at day 130), while the consumer demand has stayed unchanged (red solid line; peak at day 141). Assuming no benefits of resource surplus, the intersecting area of the resource and consumer curves (gray shaded area) divided with total consumer demand (area under red curve) is a parsimonious parameter for measuring phenological match (the percentage reported). In the classical scenario (A), where the resource availability and consumer demand are symmetric and narrow, phenological asynchrony strongly affects resource supply. In a wide and right-skewed distribution of resource availability, asynchrony has a much smaller effect (B), and changes in resource population abundance may be much more important (C). Food supply may show multiple peaks, for example corresponding to the phenology of several prey species (D), leading to a situation similar to that described in B.
Comment on
-
Global shifts in the phenological synchrony of species interactions over recent decades.Proc Natl Acad Sci U S A. 2018 May 15;115(20):5211-5216. doi: 10.1073/pnas.1714511115. Epub 2018 Apr 16. Proc Natl Acad Sci U S A. 2018. PMID: 29666247 Free PMC article.
References
-
- Walther G-R, et al. Ecological responses to recent climate change. Nature. 2002;416:389–395. - PubMed
-
- Stenseth NC, et al. Ecological effects of climate fluctuations. Science. 2002;297:1292–1296. - PubMed
-
- Knudsen E, et al. Challenging claims in the study of migratory birds and climate change. Biol Rev Camb Philos Soc. 2011;86:928–946. - PubMed
-
- Durant JM, Hjermann DØ, Ottersen G, Stenseth NC. Climate and the match or mismatch between predator requirements and resource availability. Clim Res. 2007;33:271–283.
-
- Cushing DH. The regularity of the spawning season of some fishes. ICES J Mar Sci. 1969;33:81–92.
Publication types
MeSH terms
LinkOut - more resources
Full Text Sources
Other Literature Sources
Medical
