

Optical detection of field cancerization in the buccal mucosa of patients with esophageal cancer
- PMID: 29712897
- PMCID: PMC5928160
- DOI: 10.1038/s41424-018-0023-6
Optical detection of field cancerization in the buccal mucosa of patients with esophageal cancer
Abstract
Introduction: Esophageal cancer is an increasingly common type of neoplasm with a very poor prognosis. This prognosis could improve with more early tumor detection. We have previously shown that we can use an optical spectroscopy to detect field cancerization in the buccal mucosa of patients with laryngeal cancer. The aim of this prospective study was to investigate whether we could detect field cancerization of buccal mucosa of patients with esophageal squamous cell carcinoma (ESCC) and esophageal adenocarcinoma (EAC).
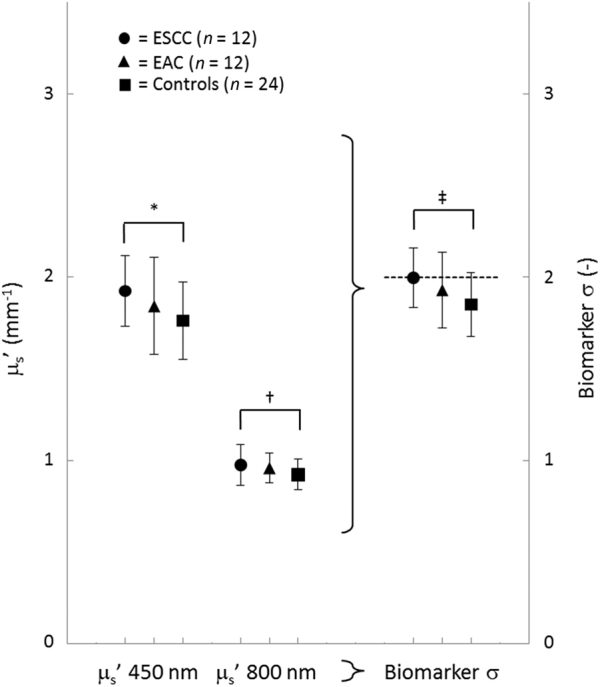
Methods: Optical measurements were performed in vivo using a novel optical technique: multidiameter single-fiber reflectance (MDSFR) spectroscopy. MDSFR spectra were acquired by a handheld probe incorporating three fiber diameters. Multiple absorption and scattering parameters that are related to the physiological and ultrastructural properties of the buccal mucosa were derived from these spectra. A linear discriminant analysis of the parameters was performed to create a combined biomarker σ to discriminate oncologic from non-oncologic patients.
Results: Twelve ESCC, 12 EAC, and 24 control patients were included in the study. The median value of our biomarker σ was significantly higher in patients with ESCC (2.07 [1.93-2.10]) than control patients (1.86 [1.73-1.95], p = 0.022). After cross-validation σ was able to identify ESCC patients with a sensitivity of 66.7% and a specificity of 70.8%. There were no significant differences between the EAC group and the control group.
Conclusion: Field cancerization in the buccal mucosa can be detected using optical spectroscopy in ESCC patients. This may be the first step towards non-invasive ESCC cancer screening.
Conflict of interest statement
Figures


Similar articles
-
Optical pre-screening for laryngeal cancer using reflectance spectroscopy of the buccal mucosa.Biomed Opt Express. 2018 Sep 6;9(10):4665-4678. doi: 10.1364/BOE.9.004665. eCollection 2018 Oct 1. Biomed Opt Express. 2018. PMID: 30319894 Free PMC article.
-
Clinicopathological, metastatic and prognostic features of stage IV esophageal adenocarcinoma versus squamous cell carcinoma: a SEER database analysis.Chin Clin Oncol. 2024 Feb;13(1):2. doi: 10.21037/cco-23-88. Epub 2024 Feb 4. Chin Clin Oncol. 2024. PMID: 38372056
-
Toward improved endoscopic surveillance with multidiameter single fiber reflectance spectroscopy in patients with Barrett's esophagus.J Biophotonics. 2021 Apr;14(4):e202000351. doi: 10.1002/jbio.202000351. Epub 2021 Jan 31. J Biophotonics. 2021. PMID: 33410602
-
Endoglin promoter hypermethylation identifies a field defect in human primary esophageal cancer.Cancer. 2013 Oct 15;119(20):3604-9. doi: 10.1002/cncr.28276. Epub 2013 Jul 24. Cancer. 2013. PMID: 23893879 Free PMC article.
-
Clinicopathological correlation of tumor-stroma ratio and inflammatory cell infiltrate with tumor grade and lymph node metastasis in squamous cell carcinoma of buccal mucosa and tongue in 41 cases with review of literature.J Cancer Res Ther. 2020 Apr-Jun;16(3):445-451. doi: 10.4103/0973-1482.193113. J Cancer Res Ther. 2020. PMID: 32719249 Review.
Cited by
-
Mildly dysplastic oral lesions with optically-detectable abnormalities share genetic similarities with severely dysplastic lesions.Oral Oncol. 2022 Dec;135:106232. doi: 10.1016/j.oraloncology.2022.106232. Epub 2022 Nov 3. Oral Oncol. 2022. PMID: 36335817 Free PMC article.
-
Subdiffuse scattering and absorption model for single fiber reflectance spectroscopy.Biomed Opt Express. 2020 Oct 22;11(11):6620-6633. doi: 10.1364/BOE.402466. eCollection 2020 Nov 1. Biomed Opt Express. 2020. PMID: 33282512 Free PMC article.
-
Towards the Optical Detection of Field Cancerization in the Buccal Mucosa of Patients with Lung Cancer.Transl Oncol. 2019 Dec;12(12):1533-1538. doi: 10.1016/j.tranon.2019.07.018. Epub 2019 Aug 29. Transl Oncol. 2019. PMID: 31473370 Free PMC article.
-
Experimental validation of a recently developed model for single-fiber reflectance spectroscopy.J Biomed Opt. 2021 Feb;26(2):025004. doi: 10.1117/1.JBO.26.2.025004. J Biomed Opt. 2021. PMID: 33641270 Free PMC article.
-
Screening for head and neck tumors in patients with esophageal squamous cell carcinoma and vice versa: a nationwide survey among medical specialists.Endosc Int Open. 2022 Sep 14;10(9):E1268-E1274. doi: 10.1055/a-1871-8552. eCollection 2022 Sep. Endosc Int Open. 2022. PMID: 36118651 Free PMC article.
References
-
- Kopelovich L, et al. Surrogate anatomic/functional sites for evaluating cancer risk: an extension of the field effect. Clin. Cancer Res. 1999;5:3899–3905. - PubMed
Publication types
MeSH terms
Supplementary concepts
LinkOut - more resources
Full Text Sources
Other Literature Sources
Medical
