. 2018 Apr 30;9(1):1725.
doi: 10.1038/s41467-018-04129-4.

Multi-omics profiling of younger Asian breast cancers reveals distinctive molecular signatures

Affiliations

Multi-omics profiling of younger Asian breast cancers reveals distinctive molecular signatures

Zhengyan Kan et al. Nat Commun. .

Abstract

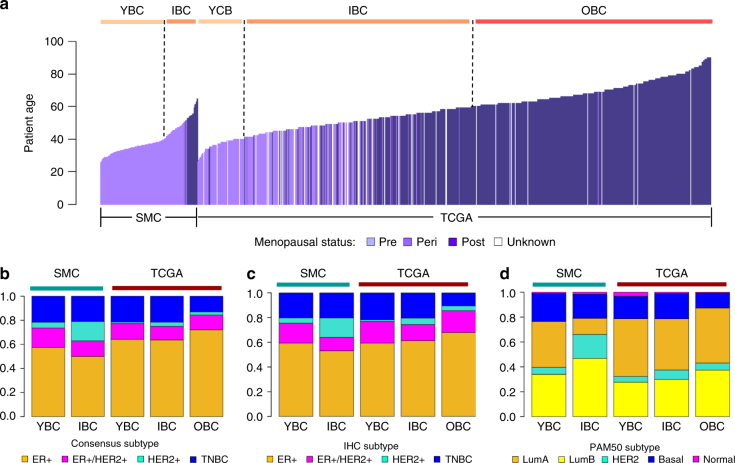
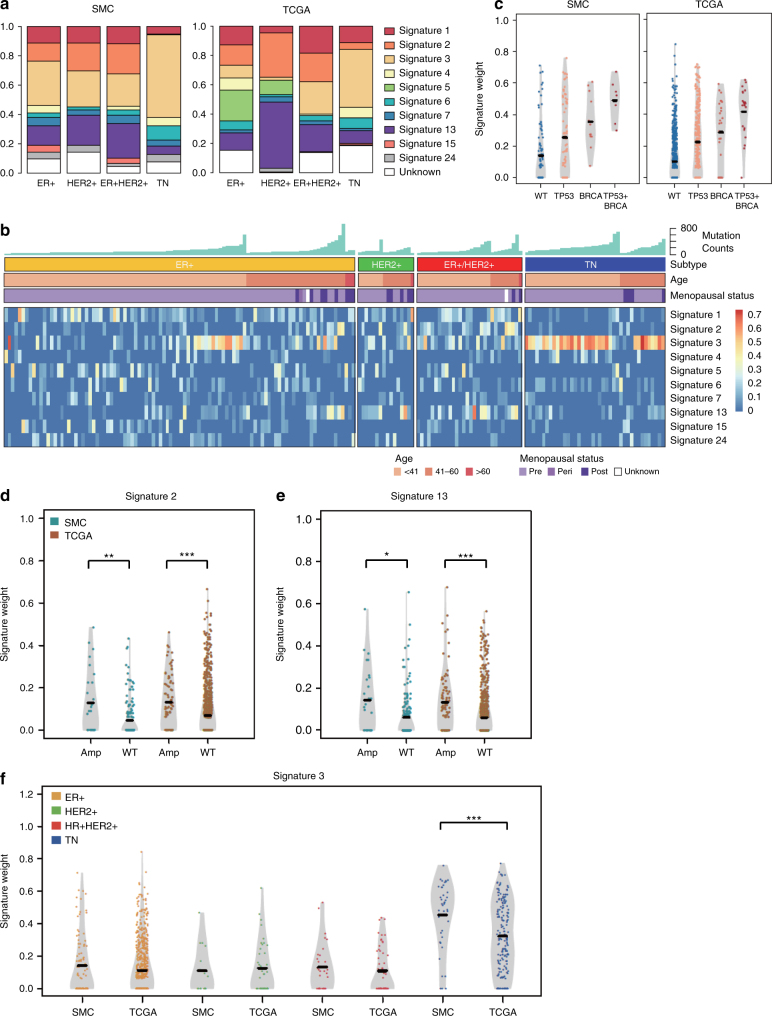
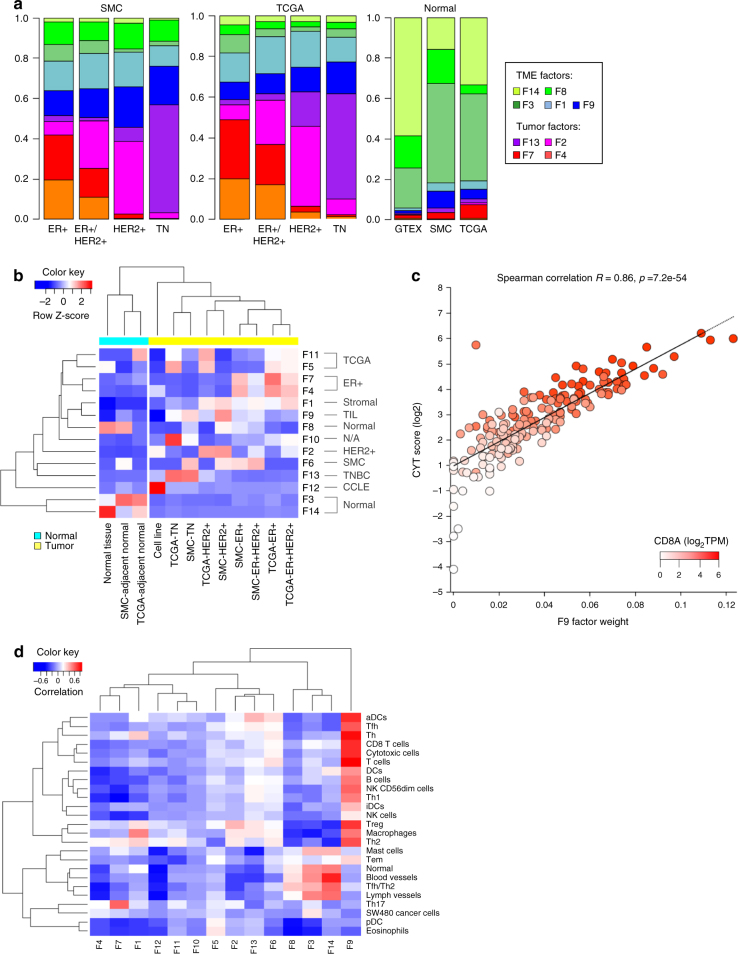
Breast cancer (BC) in the Asia Pacific regions is enriched in younger patients and rapidly rising in incidence yet its molecular bases remain poorly characterized. Here we analyze the whole exomes and transcriptomes of 187 primary tumors from a Korean BC cohort (SMC) enriched in pre-menopausal patients and perform systematic comparison with a primarily Caucasian and post-menopausal BC cohort (TCGA). SMC harbors higher proportions of HER2+ and Luminal B subtypes, lower proportion of Luminal A with decreased ESR1 expression compared to TCGA. We also observe increased mutation prevalence affecting BRCA1, BRCA2, and TP53 in SMC with an enrichment of a mutation signature linked to homologous recombination repair deficiency in TNBC. Finally, virtual microdissection and multivariate analyses reveal that Korean BC status is independently associated with increased TIL and decreased TGF-β signaling expression signatures, suggesting that younger Asian BCs harbor more immune-active microenvironment than western BCs.


Conflict of interest statement

Z.K., Y.D., S.H.L., S.L., J.F.-B., S.C., S.D., X.J.M., and Y.S. were employees of Pfizer Inc. at the time the work was performed. The remaining authors declare no competing interests.

Figures

Fig. 1
Fig. 1
Age and molecular subtype distribution in SMC and TCGA. a Bar charts comparing the distribution of patient age between SMC and TCGA colored by menopausal status. Stacked bar charts comparing molecular subtype distribution across SMC and TCGA age groups based on three classifications: Consensus (b), IHC (c), and PAM50 (d)
Fig. 2
Fig. 2
Landscape of somatic alterations in SMC and TCGA. a Heatmap showing the integrated statuses of protein-altering somatic mutations and copy number alterations affecting the most frequently altered genes (rows) and samples (columns) from SMC and TCGA. Cell colors represent different types of genomic alterations—Mut (mutation), Amp (amplification), Del (deletion), and Multi (multiple alterations). Genes are sorted by the prevalence of alterations (≥3 samples) in descending order. The bar chart above represents the sample-level count of protein-altering somatic mutations. The unstacked bar chart to the right compares the prevalence of somatic alterations in SMC and TCGA for individual genes. Column color labels represent age-based group (Cohort), intrinsic molecular subtype classifications (Consensus), and menopausal statuses for all samples. b Comparison of TP53 mutation frequencies between SMC and TCGA overall and within individual subtypes. Lobular carcinoma cases were excluded from frequency calculations. c Distribution of TP53 mutation and ERBB2 amplification statuses across PAM50 subtypes in SMC and TCGA. TP53: TP53 mutated, ERBB2: ERBB2 amplified (CN ≥ 6), ERBB2 & TP53: TP53 mutated and ERBB2 amplified, WT: wild-type TP53 and ERBB2
Fig. 3
Fig. 3
Landscape of mutation signatures in SMC and TCGA. a Distribution of major mutation signatures across subtypes in SMC and TCGA. b Heatmap showing scores of major mutation signatures in SMC samples grouped by molecular subtypes. Sample-level mutation counts, age group, and menopausal status are illustrated by colored column labels. c Violin plots comparing signature 3 scores in SMC and TCGA samples binned by BRCA1/BRCA2 mutation and TP53 mutation statuses. Horizontal line indicates the median value. Violin plots of APOBEC signatures S2 (d) and S13 (e) vs. ERBB2 amplification status (amp: CN ≥ 6; WT: CN < 6) in SMC and TCGA; f Violin plots of HRD signature S3 vs. consensus molecular subtypes of SMC and TCGA. Student’s t test: ***p < 0.001; **p < 0.01; *p < 0.05
Fig. 4
Fig. 4
Tumor virtual microdissection identified distinct tumor intrinsic and microenvironment factors. a Distribution of NMF factors representing TME or tumor intrinsic compartment across subtypes of SMC and TCGA. b Heatmap showing the mean sample factor weight for 14 NMF factors, z-normalized by rows, in different cohorts. Samples of normal tissue origins were clustered to the left and samples of tumor origins were clustered to the right. c Plot of CYT score vs. F9 factor weight with color gradient representing CD8A gene expression. d Heatmap of Pearson correlation coefficients between Bindea immune expression signature scores (GSVA) and NMF factors
Fig. 5
Fig. 5
Distribution and multivariate analyses of distinctive molecular features. Boxplots showing the distributions of TIL factor F9 weights (a), PD-L1 gene expression (b), TGF-β expression signature score (c) and TGFB1 gene expression (d) across molecular subtypes of SMC and TCGA. TPM transcript per million. pvalue was determined by Student’s t test: ***p < 0.001; **p < 0.01; *p < 0.05; NS: p ≥ 0.05. The box is bounded by the first and third quartile with a horizontal line at the median and whiskers extend to 1.5 times IQR. e Heatmap showing the statistical significance of associations (−log10p) between distinctive molecular features (rows) and key clinical features (columns) in the combined cohort. Molecular features were ranked by variable usage frequencies in descending order. Clinical features include two continuous variables—Patient age and Tumor purity and five discrete variables—Cohort status: SMC or TCGA; Subtype: ER positive or ER negative; Tumor stage: early (1−2) or late (3−4); Menopausal status: pre or post; Histology subtype: Lobular carcinoma or Invasive ductal carcinoma. Molecular features include S3: HRD-related mutation signature 3; F7: NMF factor 7 associated with ER+ subtype; F9: NMF factor 9 associated with TILs; ESR1-Exp: ESR1 gene expression; HER2-Amp: ERBB2 amplification status; BRCA-Mut: BRCA1/BRCA2 germline pathogenic mutation status; TP53-Mut: TP53 somatic mutation status; TGFB-Sig: TGF-β pathway expression signature

References

    1. GLOBOCAN 2012. Estimated cancer incidence, mortality and prevalence worldwide in 2012 (2015). Available at: https://globocan.iarc.fr/Pages/fact_sheets_cancer.aspx. (Accessed: 14th April 2018)
    1. Ferlay J, et al. Cancer incidence and mortality worldwide: sources, methods and major patterns in GLOBOCAN 2012. Int J. Cancer. 2015;136:E359–E386. doi: 10.1002/ijc.29210. - DOI - PubMed
    1. DeSantis CE, et al. Breast cancer statistics, 2015: Convergence of incidence rates between black and white women. CA Cancer J. Clin. 2015;66:31–42. doi: 10.3322/caac.21320. - DOI - PubMed
    1. Ahn SH, et al. Poor outcome of hormone receptor-positive breast cancer at very young age is due to tamoxifen resistance: nationwide survival data in Korea—a report from the Korean Breast Cancer Society. J. Clin. Oncol. 2007;25:2360–2368. doi: 10.1200/JCO.2006.10.3754. - DOI - PubMed
    1. Min SY, et al. The basic facts of Korean breast cancer in 2013: results of a Nationwide Survey and Breast Cancer Registry Database. J. Breast Cancer. 2016;19:1–7. doi: 10.4048/jbc.2016.19.1.1. - DOI - PMC - PubMed

Publication types

MeSH terms