. 2018 Jul;10(7):732-739.
doi: 10.1038/s41557-018-0053-4. Epub 2018 Apr 30.

Engineering the entropy-driven free-energy landscape of a dynamic nanoporous protein assembly

Affiliations

Engineering the entropy-driven free-energy landscape of a dynamic nanoporous protein assembly

Robert Alberstein et al. Nat Chem. 2018 Jul.

Abstract

De novo design and construction of stimuli-responsive protein assemblies that predictably switch between discrete conformational states remains an essential but highly challenging goal in biomolecular design. We previously reported synthetic, two-dimensional protein lattices self-assembled via disulfide bonding interactions, which endows them with a unique capacity to undergo coherent conformational changes without losing crystalline order. Here, we carried out all-atom molecular dynamics simulations to map the free-energy landscape of these lattices, validated this landscape through extensive structural characterization by electron microscopy and established that it is predominantly governed by solvent reorganization entropy. Subsequent redesign of the protein surface with conditionally repulsive electrostatic interactions enabled us to predictably perturb the free-energy landscape and obtain a new protein lattice whose conformational dynamics can be chemically and mechanically toggled between three different states with varying porosities and molecular densities.


Figures

Figure 1
Figure 1
Structural features of C98RhuA crystals. a, Surface representation of a C98RhuA tetramer, with positions 98 highlighted in black, and a schematic depiction of its oxidative self-assembly into porous 2D crystals. b, TEM and cartoon representations of the conformational states accessible by C98RhuA lattices and their respective ξ values. Scale bars are 50 nm. c, Description of the “interaction belt” (±10 Å of residues 98), which protrudes out from the protein. Slice views are of this belt region as viewed normal to the crystal. d, Overview of the calculation of the parameter E from experiment and its generalization to the coordinate ξ. The measured parameters and their converted values are reported for each example.
Figure 2
Figure 2
Thermodynamic analysis of C98RhuA lattice structural dynamics. a, The calculated free energy landscape and concomitant changes in solvation entropy over a continuous range of C98RhuA lattice conformations. Dotted lines identify the free energy minimum and solvation entropy maximum, and are included to guide the eye. Free energy error was calculated for each window using the block averaging method. Solvation entropy error bars reflect the standard error of mean of 8 independent calculations (see Supplementary Methods for full details). b, Direct comparison of the equilibrium conformations of C98RhuA crystals from experimental measurement (blue) and as calculated from the PMF (colorless). Experimental error bars reflect the standard deviation determined from three statistical analyses, each comprising >100 TEM images of C98RhuA crystals.
Figure 3
Figure 3
Consequences of lattice compaction on solvent structure within the pore. a, Two-dimensional plots of the normalized water density within the pore. 1D plots of the density along the pore bisector are shown below to facilitate quantitative interpretation of the data. Density scales are relative to the bulk density of neat water. Labels here and in b identify hydration effects of interest. b, Number distributions of solvent molecules proximal to the protein surface. Concentric hydration shells around the protein are identified as peaks in the distribution for ξ = 0 (left).
Figure 4
Figure 4
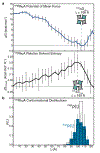
Design and analysis of the designed construct CEERhuA. a, Surface representation of a CEERhuA tetramer, with residues 98 and 57/66 colored in black and red, respectively. The installed residues are coplanar with C98 and lie within the “interaction belt”. b, Cartoon of CEERhuA lattice dynamics and the anticipated effects of the design. c, TEM images of RhuA lattices, showing the open and equilibrium states for CEERhuA alongside that for a fully closed C98RhuA crystal. Scale bars are 50 nm. d, Relative to C98RhuA, the thermodynamic analysis of CEERhuA dynamics reveals a shifted free energy minimum towards the open state, but retention of a nearly identical solvent entropy profile, demonstrating the purely enthalpic consequences of the design. The free energy and solvent entropy profiles for CEERhuA are shown as red and black lines; those for C98RhuA are depicted as faint blue and grey lines. Dotted lines identify the free energy minimum and solvation entropy maximum, and are included to guide the eye. Free energy error was calculated for each window using the block averaging method. Solvation entropy error bars reflect the standard error of mean of 8 independent calculations (see Supplementary Methods for full details). e, Experimental distributions of CEERhuA conformations over multiple cycles of sedimentation and resuspension. Equilibrium distributions are significantly more open than C98RhuA, and slightly more open than predicted by the PMF. Gaussian fits to each distribution are labeled with their center (c) and standard deviation (σ). n is the number of crystals analyzed. The lattice conformation of each inset is marked with an asterisk.
Figure 5
Figure 5
Chemical and mechanical switching behavior of CEERhuA crystals. a, Cartoon depicting all possible switching modes of CEERhuA lattices, with each cartoon state directly corresponding to the experimental distribution(s) below it. Addition of 20 mM Ca2+ to the equilibrium “ajar” population of CEERhuA crystals induces a shift towards more closed conformations, from which C98RhuA-like mechanical switching is possible. The ajar conformation is fully recoverable upon removal of Ca2+ via dialysis or EDTA, thus providing three distinct switching modes. Gaussian fits to each distribution are labeled with their center (c) and standard deviation (σ). n is the number of crystals analyzed. The lattice conformation of each inset is marked with an asterisk. b, Summary of switching modes for RhuA crystals. In contrast with C98RhuA, CEERhuA has two mechanical modes dictated by the presence of Ca2+, as well as a purely chemical mode via the addition/removal of Ca2+.

Similar articles

Cited by

References

    1. Marsh JA & Teichmann SA Structure, Dynamics, Assembly, and Evolution of Protein Complexes. Annu. Rev. Biochem 84, 551–575 (2015). - PubMed
    1. Salgado EN, Radford RJ & Tezcan FA Metal-directed protein self-assembly. Acc. Chem. Res 43, 661–672 (2010). - PMC - PubMed
    1. Song WJ & Tezcan FA A designed supramolecular protein assembly with in vivo enzymatic activity. Science 346, 1525–1528 (2014). - PubMed
    1. Yeates TO Geometric Principles for Designing Highly Symmetric Self-Assembling Protein Nanomaterials. Annu. Rev. Biophys 46, 23–42 (2017). - PubMed
    1. Bale JB et al. Accurate design of megadalton-scale two-component icosahedral protein complexes. Science 353, 389–394 (2016). - PMC - PubMed

Publication types