. 2018 Aug;37(31):4334-4342.
doi: 10.1038/s41388-018-0264-6. Epub 2018 May 1.

Pre-neoplastic pancreas cells enter a partially mesenchymal state following transient TGF-β exposure

Affiliations

Pre-neoplastic pancreas cells enter a partially mesenchymal state following transient TGF-β exposure

Jesse Handler et al. Oncogene. 2018 Aug.

Abstract

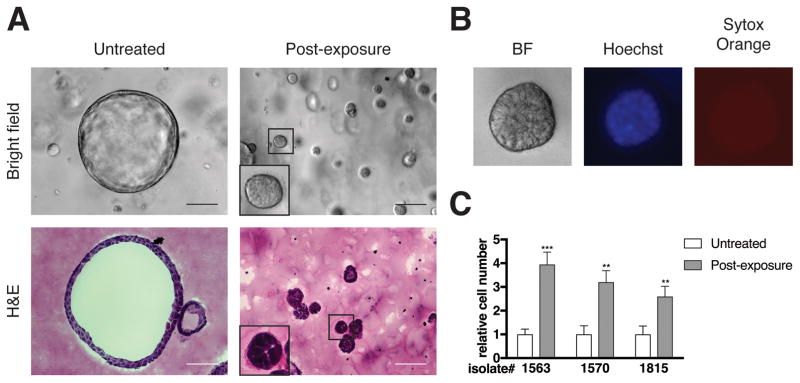
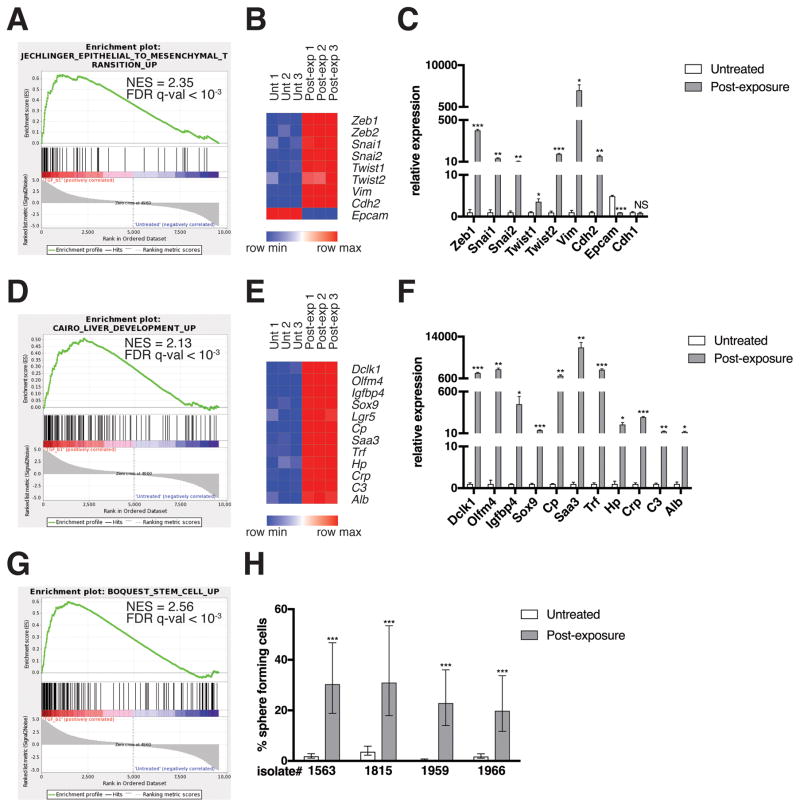
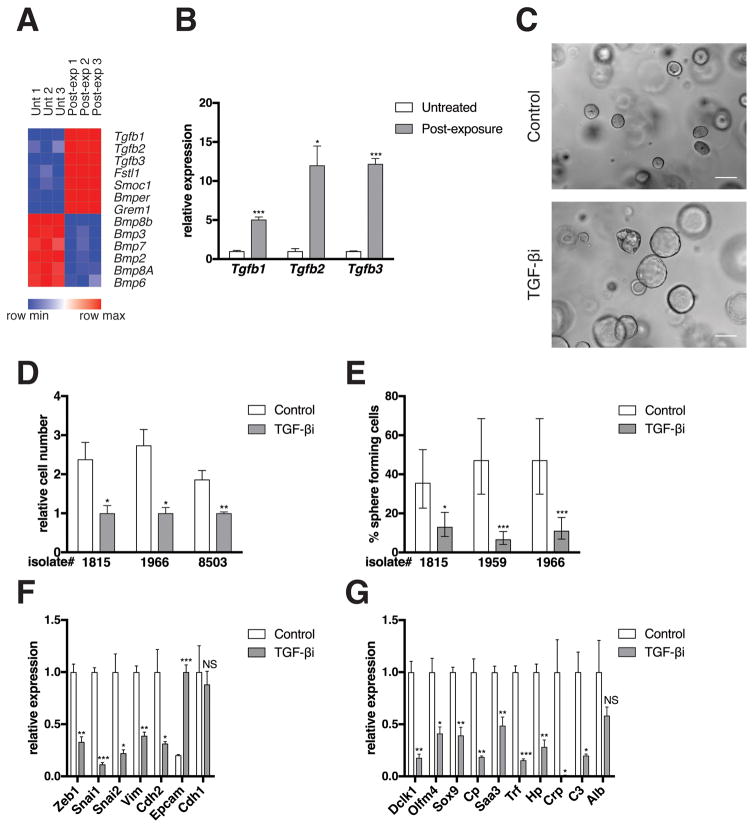
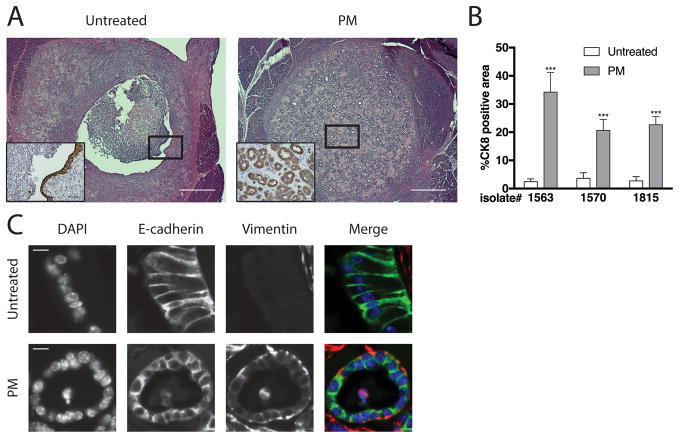
Pancreatic ductal adenocarcinoma (PDAC) is a deadly disease and a major health problem in the United States. While the cytokine TGF-β has been implicated in PDAC development, it can exert both pro-tumorigenic and anti-tumorigenic effects that are highly context dependent and incompletely understood. Using three-dimensional (3D) cultures of KrasG12D-expressing mouse pancreatic epithelial cells we demonstrated that while exposure to exogenous TGF-β induced growth arrest of the KrasG12D cells, its subsequent removal allowed the cells to enter a hyper-proliferative, partially mesenchymal (PM), and progenitor-like state. This state was highly stable and was maintained by autocrine TGF-β signaling. While untreated KrasG12D cells formed cystic lesions in vivo, PM cells formed ductal structures resembling human PanINs, suggesting that they had attained increased oncogenic potential. Supporting this hypothesis, we determined that the PM cells share salient molecular and phenotypic features with the quasi-mesenchymal/squamous subtype of human PDAC, which has the worst prognosis of any of the recently identified subtypes. Transient pulses of TGF-β have been observed during pancreatitis, a major risk factor for PDAC. Our data suggest that transient TGF-β exposure is sufficient to induce the acquisition of stable PDAC-associated phenotypes in pre-neoplastic KrasG12D cells, providing novel molecular insight into the complex role of TGF-β in tumorigenesis.


Conflict of interest statement

CONFLICTS OF INTEREST

The authors have no conflicts of interest to disclose.

Figures

Figure 1
Figure 1. Transient TGF-β exposure alters the architecture and proliferation rate of KC cells
Pancreas explants were harvested from LSL-KrasG12D;p48-Cre (KC, ref. 14) mice between 3.5 and 4.5 weeks of age as described previously (35), except that the cells were plated on Matrigel (354234, Corning; Corning, NY, USA). Following three days in culture at 37°C in 5% CO2 in air, the resulting ductal structures were removed from the Matrigel using Dispase (50 U/mL for 15 minutes at 37°C; 354235, Corning), trypsinized (0.05%, 2 × 3 minutes at 37°C, Gibco, Gaithersburg, MD, USA), and then embedded in Matrigel as described previously (16). Cells were treated without (untreated) or immediately with (post-exposure) human recombinant TGF-β1 (500 pg/mL; 240-B-002, R&D systems; Minneapolis, MN, USA) added to the culture medium. After two days, the TGF-β was removed and the cells were propagated for four weeks, after which experiments were performed. Media was replaced every two days. (A) Bright field images of live cells and hematoxylin and eosin (H&E; HHS32, HT110332 Sigma) stained sections are shown. Scale bars, 100 μm. (B) Bright field and fluorescent live images of TGF-β-treated cells stained with Hoechst 33342 (H1399, ThermoFisher; Waltham, MA, USA) and SYTOX Orange (S11368, ThermoFisher) according to the manufacturer’s protocols are shown. For (A) and (B), bright field and fluorescence images were obtained using a Zeiss Axiovert 200M microscope. Cells were prepared for cryosectioning (36) followed by H&E staining (16) as described previously with de-paraffinization and dehydration steps omitted, and imaged using a Nikon Eclipse 80i microscope. All images were processed using ImageJ and Adobe Photoshop software. Images are representative of five independent isolates. (C) Relative cell number of three independent isolates as determined by manual cell counting using a hemocytometer is shown. Error bars indicate mean +/− SD from independent experiments (n = 4–5). P values determined using a Student’s t test (unpaired, two tailed). **, P < 0.001. ***, p<0.0001. All animal care and procedures were approved by the Institutional Animal Care and Use Committee at NYU School of Medicine.
Figure 2
Figure 2. EMT and de-differentiation signature genes are enriched in post-TGF-β-exposure KC cells
(A, D, G) GSEA enrichment plots of the indicated gene sets amongst the genes upregulated in post-TGF-β exposure KC cells relative to untreated KC cells are shown. NES, normalized enrichment score. RNA was isolated using an RNeasy mini kit (74104, QIAGEN; Venlo, Netherlands) from cells generated from LSL-KrasG12D;Pdx1-Cre;LSL-YFP (KCY)(18) mice, which behaved identically to KC cells. Three technical replicates per experimental group from one isolate were analyzed by RNA sequencing. Genomic DNA was removed using an RNase-free DNase kit (79254, QIAGEN). RNA sequencing was performed using an Illumina HiSeq2500 instrument. To generate differential expression values, sequencing results were demultiplexed and converted to FASTQ format using Illumina Bcl2FastQ software. Paired-end reads were aligned to the mouse genome (build mm10/ GRCm38) using the splice-aware STAR aligner (37). PCR duplicates were removed using the Picard toolkit (38). The HTSeq package (39) was utilized to generate counts for each gene based on how many aligned reads overlap its exons. These counts were then normalized and used to test for differential expression using negative binomial generalized linear models implemented by the DESeq2 R package (40). P values were corrected for multiple hypothesis testing using the Benjamini-Hochberg method (41). Results were considered significant when p < 0.05. This data is publicly available via the Gene Expression Omnibus (42), accession #GSE101659. The Gene Set Enrichment Analysis (GSEA) software (19) was run using the curated gene sets and oncogenic signatures from the Molecular Signatures Database (MSigDB). (B, E) Heat maps of representative EMT and de-differentiation signature genes are shown. Expression levels shown are representative of log2(x + 1) transformed normalized read counts in each replicate. Expression relative to the maximum (red) and minimum (blue) level per gene across samples is shown. Heat maps were generated using GENE-E software (43). (C, F) mRNA levels of differentially expressed genes as measured by qRT-PCR are shown. Reverse transcription was performed using a QuantiTect reverse transcription kit (205311, QIAGEN). USB HotStart-IT SYBR Green qPCR Master Mix (75762, Affymetrix; Santa Clara, CA, USA) was used for amplification. See Table S1 for a list of primers used in this study. Samples were amplified on the Stratagene Mx 3005P. Differences in expression were determined using the 2−ΔΔCT method (44) using RPS29 as a housekeeping control. Expression levels from one isolate representative of the four individual isolates tested are shown. Three technical replicates were used per experimental group per isolate. Error bars indicate mean +/− SD from three technical replicates. P values determined using a Student’s t test (unpaired, two tailed). *, P < 0.05. **, P < 0.001. ***, P < 0.0001. NS, not significant. (H) Quantification of sphere formation capacity is shown. One sphere formation assay was performed per isolate for the four individual isolates tested. Cells were plated at densities ranging from 2000 cells/well-0.25 cells/well, 8 replicates per dilution, under conditions described previously to enrich for mammary stem cells (17). Following a 7-day incubation, the presence or absence of spheres was ascertained using bright field microscopy. Data is represented as the estimated percentage of cells able to form spheres, as calculated using ELDA statistical software (45), with error bars indicating the upper and lower limits of a 95% confidence interval. P values for differences between groups were generated by the software. ***, P < 0.0001.
Figure 3
Figure 3. Autocrine TGF-β signaling maintains the PM phenotype
(A) Heat map of TGF-β and BMP genes is shown. See Figure 2B for methods. (B) mRNA levels of differentially expressed genes as measured by qRT-PCR is shown. See Figure 2C for methods. (C) Bright field images are shown from a single isolate representative of three independent isolates tested. PM cells were either not treated (Control) or treated with the TGF-βR1 kinase inhibitor LY364947 (1 μg/mL; 616451, EMD Millipore; Mahopac, NY, USA) for six days (TGF-βi). Scale bars, 100 μm. See Figure 1A for image capture and processing methods. (D) Relative cell number of three independent isolates as determined by manual cell counting using a hemocytometer is shown (Cells from isolate 8503 were generated from a KCY mouse [see Figure 2A]). PM cells were treated with DMSO (Control) or LY364947 (TGF-βi) for six days. Error bars indicate mean +/− SD from three technical replicates. P values determined using a Student’s t test (unpaired, two tailed). *, P < 0.05. **, P < 0.001. (E) Quantification of sphere formation capacity is shown. PM cells were treated with DMSO (Control) or LY364947 (TGF-βi) for six days. One sphere formation assay was performed per isolate for the three isolates tested. See Figure 2H for methods. Data represented as described in Figure 2H. *, P < 0.05. ***, P < 0.0001. (F–G) mRNA levels of EMT (F) and de-differentiation signature (G) genes as measured by qRT-PCR is shown. PM cells were either not treated (Control) or exposed to LY364947 (TGF-βi) for six days. Expression levels from one isolate representative of the three individual isolates tested are shown. See Figure 2C for methods.
Figure 4
Figure 4. PM cells form ductal lesions resembling PanINs in vivo
Untreated or PM cells were implanted into pancreata of WT syngeneic C57/Bl6 mice (027, Charles River Laboratories, Wilmington, MA, USA) as described previously (16). Two weeks after implantation, the mice were sacrificed and the pancreata harvested. Tissue processing, sectioning, histology, immunohistochemistry, immunostaining, and image acquisition, processing, and analysis were performed as described previously (16). (A) Sections stained with H&E or immunostained for CK8 (insets) are shown. Scale bars, 500 μm or 50μm (insets). Images shown are representative of three independent experiments performed with separate isolates (n = 4–6 mice per group). Sample size was based on previously published studies (16). No randomization or blinding was performed. CK8 antibody (1:200, TROMA-Ic, DSHB, University of Iowa; Iowa City, IA, USA). (B) Quantification of %CK8 positive area within the lesion as determined using ImageJ software is shown. Error bars indicate mean +/− SD. P values determined using a Student’s t test (unpaired, two tailed). ***, P < 0.0001. (C) Representative sections immunostained for E-cadherin and vimentin are shown. Antibodies used were E-cadherin (1:200; 610181, BD, Franklin Lakes, NJ, USA). Vimentin (1:200; 5741, Cell Signaling Technology; Danvers, MA, USA). Scale bars, 10μm.

References

    1. American Cancer Society. Cancer Facts & Figures 2017. Atlanta: American Cancer Society; 2017.
    1. Ryan DP, Hong TS, Bardeesy N. Pancreatic adenocarcinoma. N Engl J Med. 2014;371:1039–49. - PubMed
    1. Massague J. TGFbeta signalling in context. Nat Rev Mol Cell Biol. 2012;13:616–30. - PMC - PubMed
    1. Friess H, Yamanaka Y, Buchler M, Ebert M, Beger HG, Gold LI, et al. Enhanced expression of transforming growth factor beta isoforms in pancreatic cancer correlates with decreased survival. Gastroenterology. 1993;105:1846–56. - PubMed
    1. Hezel AF, Deshpande V, Zimmerman SM, Contino G, Alagesan B, O’Dell MR, et al. TGF-beta and alphavbeta6 integrin act in a common pathway to suppress pancreatic cancer progression. Cancer Res. 2012;72:4840–5. - PMC - PubMed

Publication types

MeSH terms

Substances