Multicenter Study
. 2018 May;24(5):679-690.
doi: 10.1038/s41591-018-0016-8. Epub 2018 Apr 30.

Molecular subtypes of diffuse large B cell lymphoma are associated with distinct pathogenic mechanisms and outcomes

Affiliations
Multicenter Study

Molecular subtypes of diffuse large B cell lymphoma are associated with distinct pathogenic mechanisms and outcomes

Bjoern Chapuy et al. Nat Med. 2018 May.

Erratum in

  • Publisher Correction: Molecular subtypes of diffuse large B cell lymphoma are associated with distinct pathogenic mechanisms and outcomes.
    Chapuy B, Stewart C, Dunford AJ, Kim J, Kamburov A, Redd RA, Lawrence MS, Roemer MGM, Li AJ, Ziepert M, Staiger AM, Wala JA, Ducar MD, Leshchiner I, Rheinbay E, Taylor-Weiner A, Coughlin CA, Hess JM, Pedamallu CS, Livitz D, Rosebrock D, Rosenberg M, Tracy AA, Horn H, van Hummelen P, Feldman AL, Link BK, Novak AJ, Cerhan JR, Habermann TM, Siebert R, Rosenwald A, Thorner AR, Meyerson ML, Golub TR, Beroukhim R, Wulf GG, Ott G, Rodig SJ, Monti S, Neuberg DS, Loeffler M, Pfreundschuh M, Trümper L, Getz G, Shipp MA. Chapuy B, et al. Nat Med. 2018 Aug;24(8):1292. doi: 10.1038/s41591-018-0098-3. Nat Med. 2018. PMID: 29955181
  • Author Correction: Molecular subtypes of diffuse large B cell lymphoma are associated with distinct pathogenic mechanisms and outcomes.
    Chapuy B, Stewart C, Dunford AJ, Kim J, Kamburov A, Redd RA, Lawrence MS, Roemer MGM, Li AJ, Ziepert M, Staiger AM, Wala JA, Ducar MD, Leshchiner I, Rheinbay E, Taylor-Weiner A, Coughlin CA, Hess JM, Pedamallu CS, Livitz D, Rosebrock D, Rosenberg M, Tracy AA, Horn H, van Hummelen P, Feldman AL, Link BK, Novak AJ, Cerhan JR, Habermann TM, Siebert R, Rosenwald A, Thorner AR, Meyerson ML, Golub TR, Beroukhim R, Wulf GG, Ott G, Rodig SJ, Monti S, Neuberg DS, Loeffler M, Pfreundschuh M, Trümper L, Getz G, Shipp MA. Chapuy B, et al. Nat Med. 2018 Aug;24(8):1290-1291. doi: 10.1038/s41591-018-0097-4. Nat Med. 2018. PMID: 29955182

Abstract

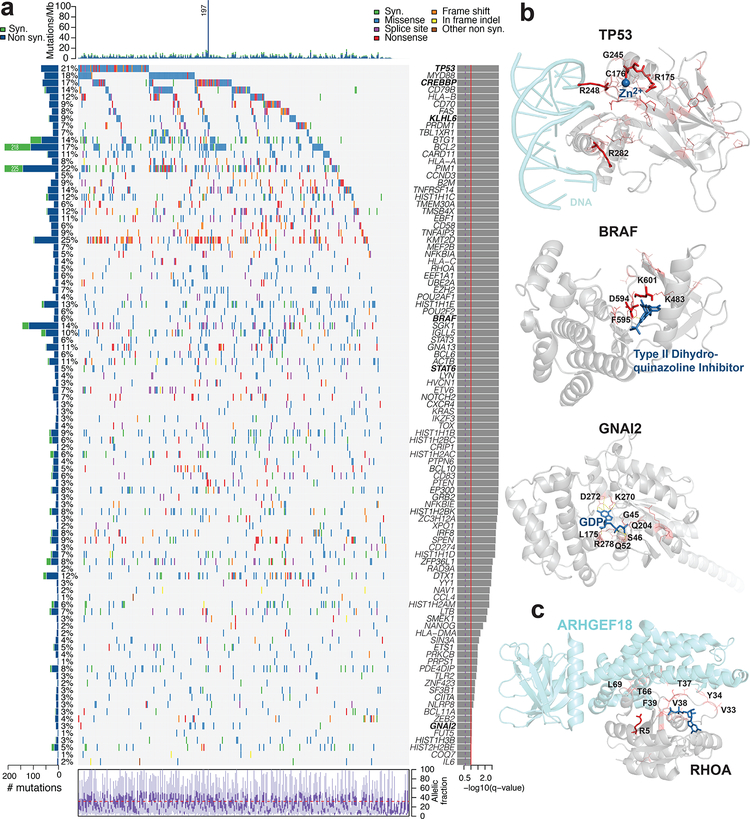
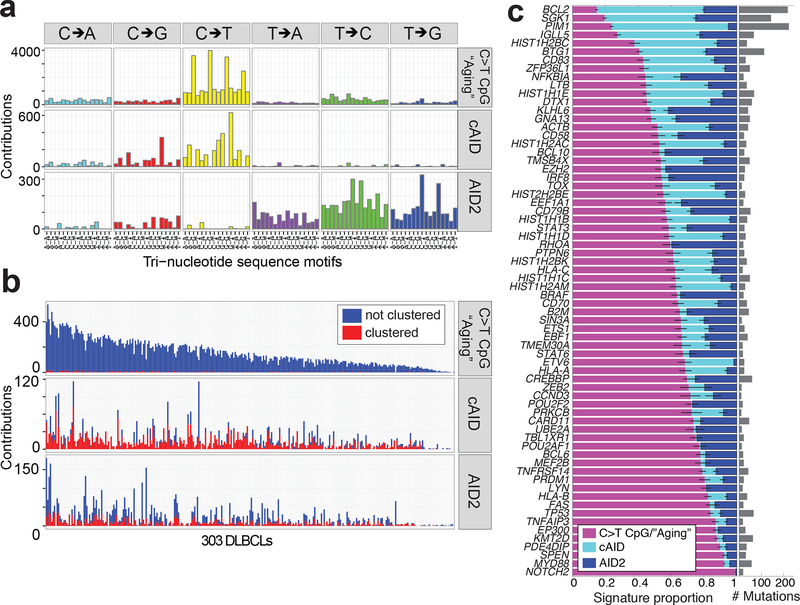
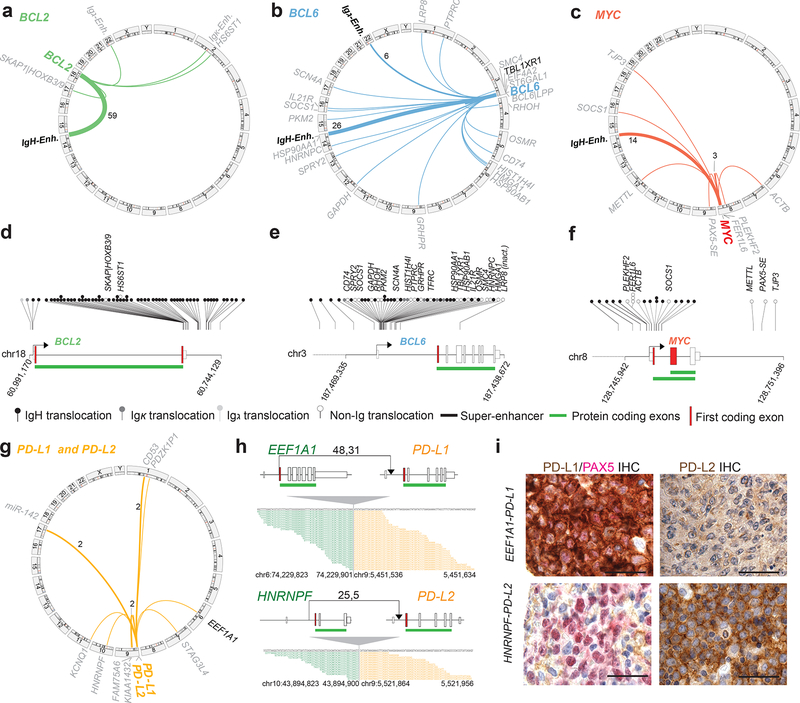
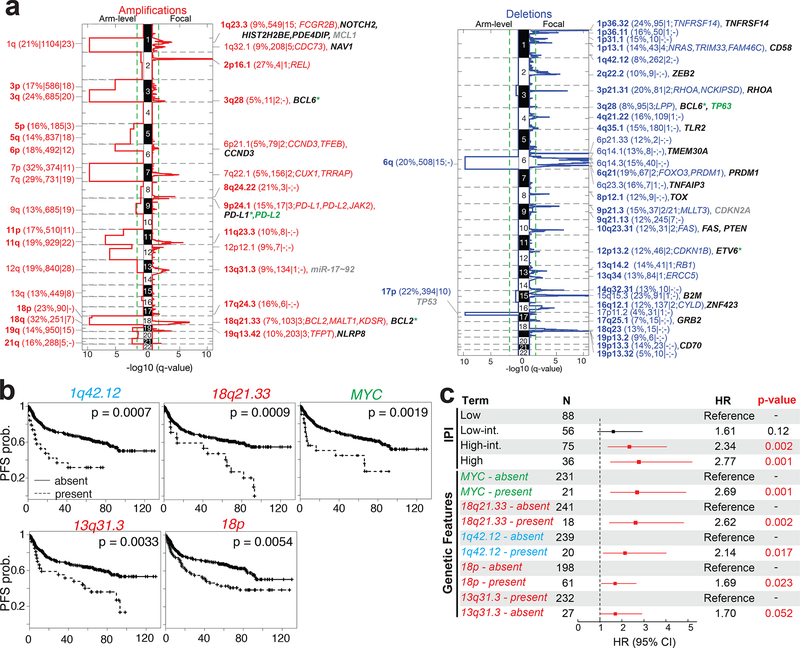
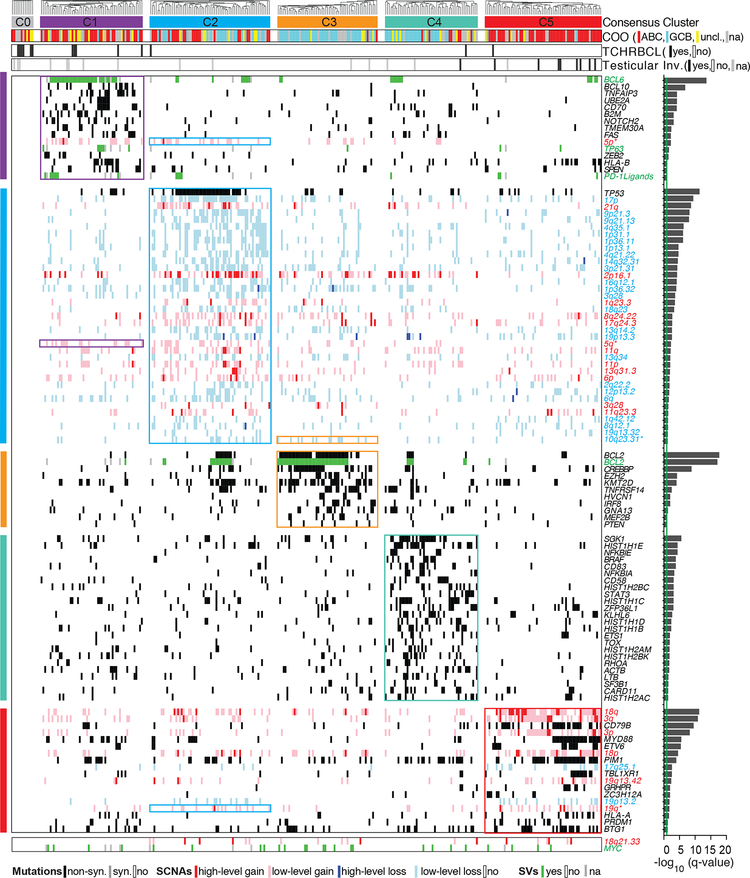
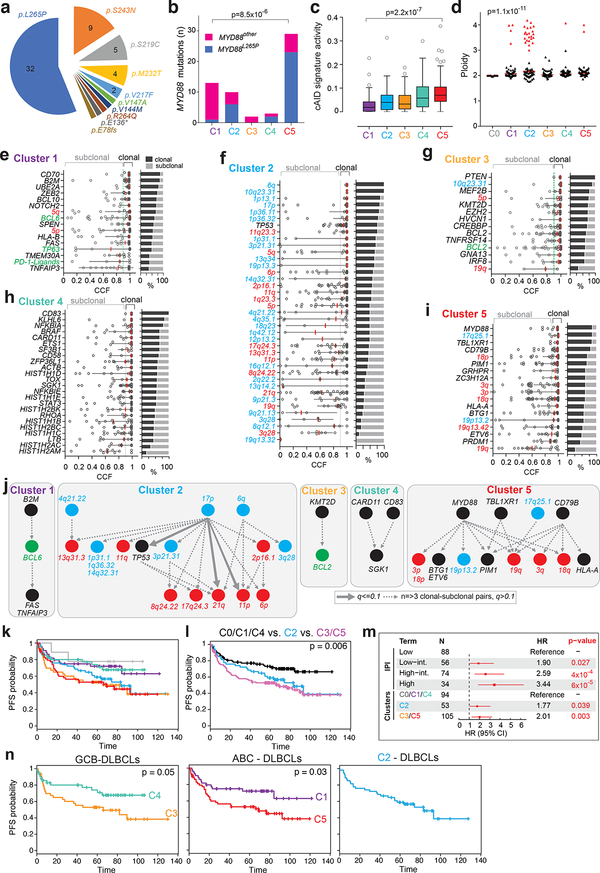
Diffuse large B cell lymphoma (DLBCL), the most common lymphoid malignancy in adults, is a clinically and genetically heterogeneous disease that is further classified into transcriptionally defined activated B cell (ABC) and germinal center B cell (GCB) subtypes. We carried out a comprehensive genetic analysis of 304 primary DLBCLs and identified low-frequency alterations, captured recurrent mutations, somatic copy number alterations, and structural variants, and defined coordinate signatures in patients with available outcome data. We integrated these genetic drivers using consensus clustering and identified five robust DLBCL subsets, including a previously unrecognized group of low-risk ABC-DLBCLs of extrafollicular/marginal zone origin; two distinct subsets of GCB-DLBCLs with different outcomes and targetable alterations; and an ABC/GCB-independent group with biallelic inactivation of TP53, CDKN2A loss, and associated genomic instability. The genetic features of the newly characterized subsets, their mutational signatures, and the temporal ordering of identified alterations provide new insights into DLBCL pathogenesis. The coordinate genetic signatures also predict outcome independent of the clinical International Prognostic Index and suggest new combination treatment strategies. More broadly, our results provide a roadmap for an actionable DLBCL classification.


Conflict of interest statement

Competing Financial Interest Statement

The authors declare that they have no competing financial interests.

Figures

Figure 1.
Figure 1.. Recurrently mutated genes in 304 primary DLBCLs.
a, Number and frequency of recurrent mutations (left), gene-sample matrix of recurrently mutated genes (color-coded by type, center), ranked by their significance (MutSig2CV q-value, right). Total mutation density across the cohort is shown at the top, allelic fraction of mutations at the bottom. Asterisk indicates hypermutator case. b, Genes that were also idenitified by CLUMPS include: TP53, CREBBP, KLHL6, BRAF, STAT6, and GNAI2. Representative examples of genes with significant spacial clustering in protein structures (gray): TP53 (top; PDB:4MZR), BRAF (middle; PDB ID:4G9R), GNAI2 (bottom; PDB:1AGR). Mutated residues are shown in red and color intensity scales with number of mutations. Polar interactions in dotted yellow lines. Frequently mutated residues are labeled in black. Co-crystalized proteins are shown in blue (Zn+, Type II dihydroquinazoline inhibitor and GDP). c, Co-crystal structure of RHOA (gray) and ARHGEF18 (cyan; PDB:4D0N) highlights mutational clustering at the RHOA-ARHGEF interface. Residues at the interface in black.
Figure 2.
Figure 2.. Mutational signatures operating in primary DLBCLs.
a, Mutation signature analysis with the clustering information of mutations quantified by the nearest mutation distance (NMD) identified three mutational signatures; C>T mutations at CpG islands (C>T CpG, hereafter “Aging“), canonical AID (cAID) and a secondary AID signature (AID2) in 303 DLBCL samples. One sample with a predominant contribution of the MSI signature activity (SNVs > 5,000; Methods) was excluded. b, Signature activity (the number of mutations assigned to each signature) in each group of clustered (red; NMD ≤ 1kb) and non-clustered mutations (blue; NMD > 1kb) across 303 DLBCL samples sorted by decreasing mutation count. c, Relative enrichment of signature activities in significantly mutated genes with at least 10 mutations. Number of mutations per gene on the right. Genes are sorted by prevalence of the aging signature. Error bars show the standard error of the mean.
Figure 3.
Figure 3.. Chromosomal rearrangements in primary DLBCLs.
a-c, SVs of BCL2 (a, green), BCL6 (b, blue), MYC (c, red) and partner genes (gray) are visualized as Circos plots. Genes also targeted by somatic mutations are highlighted in black. Thickness of partner linking lines indicates frequency (numbers indicate frequency >1). d-f, Breakpoints within BCL2 (d), BCL6 (e) and MYC (f) are plotted in their indicated genomic context. Arrows indicate the transcription start site in the coding direction; boxes indicate exons including first coding exon (red); green bar below indicates which exons are protein coding. Translocation partners are indicated by the shading of the circle at the tip of each breakpoint (IgH, black; Igκ, dark gray; Igλ, light gray; non-Ig partners, white and name of partner gene above). g, Circos plots of chromosomal rearrangements involving the PD-1 ligand loci, PD-L1 and PD-L2, (orange). Labeling as in (a-d). h, Stick figures for indicated translocations involving either PD-L1 or PD-L2. See (h) for details. Raw reads count visualized below. Reads mapping to the first and second partner gene are highlighted in green and orange, respectively. i, PD-L1/PAX5 (left panel, PD-L1, brown; PAX5, pink) and PD-L2 (right; PD-L2, brown) immunohistochemical (IHC) analyses of the cases in (h). IHC was repeated twice with similar results.
Figure 4.
Figure 4.. Recurrent SCNAs and outcome association of individual genetic factors.
a, GISTIC2.0-defined recurrent copy number gains (red, left) and losses (blue, right) are visualized as mirror GISTIC plots, with arm-level events, left and focal events, right. Chromosomes on the vertical axis. Green line denotes q-value of 0.1. SCNAs are labeled with their associated cytoband/arm followed in brackets by the frequency of the alteration, the number of total genes and COSMIC-defined cancer genes in GISTIC2.0-defined regions, respectively. For focal events, COSMIC cancer genes with a positive correlation to gene expression in our data (fold change >1.2, q<0.25) are indicated within the brackets. Genes that are also significantly mutated (in black) or subject to chromosomal rearrangement (n=>2, green) in our dataset are highlighted after the brackets. Other important drivers are labeled in gray. b, Kaplan Meier plots of individual genetic factors predictive for PFS in univariate and multivariate models of the R-CHOP treated cohort with PFS data (n=254); alterations present, dashed line; P values derived from log-rank test. c, Forest plots visualize the multivariate analysis of IPI risk groups and individual genetic factors for PFS in the R-CHOP treated cohort with PFS data (n=254).
Figure 5.
Figure 5.. Identification of groups of tumors with coordinate genetic signatures.
a, Non-negative matrix factorization consensus clustering was performed using all CCGs, SCNAs and SVs in the 304 DLBCL samples (columns). Clusters C1-C5 with their associated landmark genetic alterations are visualized (boxed for each cluster). Samples without driver alterations are represented as Cluster C0. Genetic alterations that are positively associated with each cluster are identified by a one-sided Fisher test and ranked by significance (q<0.1, green line, bar graph to the right). Non-synonymous mutations, black; synonymous mutations, gray; single CN loss (1.1 ≤ CN ≤1.6 copies), cyan; double CN loss (CN ≤ 1.1), blue; low level CN gain (3.7 copies ≥ CN ≥ 2.2 copies), pink; high grade CN gain (CN ≥ 3.7 copies), red; chromosomal rearrangement, green; no alterations, white; gray-crossed, not assessed. Header shows cluster association (C0, gray; C1, purple; C2, blue; C3, orange; C4, turquoise; C5, red), COO classification (ABC, red; GCB, cyan; unclassifiable, yellow; not assessed, gray), TCHRBCL cases (black, yes; white, no), and testicular involvement (black, yes; white, no; gray, na). Outcome-associated alterations that are not part of a specific cluster, SVs of MYC and 18q21.33 copy gain are shown below.
Figure 6.
Figure 6.. Type and incidence of MYD88 mutations, cAID mutational signature activity, inferred timing of genetic drivers and outcome association of DLBCL clusters.
a, Type of MYD88 mutations. b, Frequency of MYD88L265P and MYD88other mutations across clusters C1-C5 (n=292); P values by two-sided Fisher’s Exact test. c, Fraction of cAID mutational signature activity in clusters C1-C5 (n=292) as a Tukey boxplot (center, median; box, interquartile range [IQR]; whiskers, 1.5x IQR); P values by two-sided Mann-Whitney U test. d, Ploidy as inferred by ABSOLUTE in clusters C1-C5 (n=292) as scatter plot (red line, median). DLBCLs with genome doublings (an inferred ploidy ≥ 3) are indicated in red; P value by two-sided Fisher’s Exact test. e-i, Cancer cell fractions (CCF) of clusters C1-C5 (C1, n=56; C2, n=66; C3, n=55; C4, n=51; C5, n=64) are plotted and ranked by the fraction of clonal events of each landmark alteration (high to low, right panel). Median CCF in red bar, error bar represents the interquartile range. Mutations, black; CN gain, red; CN loss, blue; SVs, green. The threshold for assigning an alteration to be “clonal” is a CCF of ≥0.9 (green dotted line). j, Timing of cluster-associated alterations is visualized with early events at top; late events at bottom. Color indicates alteration type as above. Arrows between 2 alterations are drawn when 2 drivers are found in one sample with an excess of clonal to subclonal events. Line type of arrows indicates significance derived from a binomial test (solid thick arrow, q value < 0.1; dotted line, too few clonal-subclonal pairs to formally test with binominal test). k, Kaplan Meier plots for PFS for all clusters, C0 (gray), C1 (purple), C2 (blue), C3 (orange), C4 (turquoise), C5 (red). l, KM plot for PFS for favorable DLBCL clusters (C0, C1,C4) in black, C2-DLBCLs in blue and unfavorable DLBCLs (C3, C5) in pink. The p-value obtained using the log-rank test. m, KM plot for PFS for the genetically distinct GCB-DLBCL clusters (C3 and C4; left), the ABC-DLBCL clusters (C1 and C5; middle) and C2 DLBCLs. The p-value obtained using the log-rank test. n, Forest plots visualize HR and p-values obtained from the multivariate analysis of clusters and IPI for PFS. k-n, Analyses were performed in the R-CHOP treated cohort with PFS data (n=254).

Similar articles

  • Diffuse large B-cell lymphoma patient-derived xenograft models capture the molecular and biological heterogeneity of the disease.
    Chapuy B, Cheng H, Watahiki A, Ducar MD, Tan Y, Chen L, Roemer MG, Ouyang J, Christie AL, Zhang L, Gusenleitner D, Abo RP, Farinha P, von Bonin F, Thorner AR, Sun HH, Gascoyne RD, Pinkus GS, van Hummelen P, Wulf GG, Aster JC, Weinstock DM, Monti S, Rodig SJ, Wang Y, Shipp MA. Chapuy B, et al. Blood. 2016 May 5;127(18):2203-13. doi: 10.1182/blood-2015-09-672352. Epub 2016 Jan 15. Blood. 2016. PMID: 26773040 Free PMC article.
  • Molecular subtypes of diffuse large B-cell lymphoma arise by distinct genetic pathways.
    Lenz G, Wright GW, Emre NC, Kohlhammer H, Dave SS, Davis RE, Carty S, Lam LT, Shaffer AL, Xiao W, Powell J, Rosenwald A, Ott G, Muller-Hermelink HK, Gascoyne RD, Connors JM, Campo E, Jaffe ES, Delabie J, Smeland EB, Rimsza LM, Fisher RI, Weisenburger DD, Chan WC, Staudt LM. Lenz G, et al. Proc Natl Acad Sci U S A. 2008 Sep 9;105(36):13520-5. doi: 10.1073/pnas.0804295105. Epub 2008 Sep 2. Proc Natl Acad Sci U S A. 2008. PMID: 18765795 Free PMC article.
  • Genetics and Pathogenesis of Diffuse Large B-Cell Lymphoma.
    Schmitz R, Wright GW, Huang DW, Johnson CA, Phelan JD, Wang JQ, Roulland S, Kasbekar M, Young RM, Shaffer AL, Hodson DJ, Xiao W, Yu X, Yang Y, Zhao H, Xu W, Liu X, Zhou B, Du W, Chan WC, Jaffe ES, Gascoyne RD, Connors JM, Campo E, Lopez-Guillermo A, Rosenwald A, Ott G, Delabie J, Rimsza LM, Tay Kuang Wei K, Zelenetz AD, Leonard JP, Bartlett NL, Tran B, Shetty J, Zhao Y, Soppet DR, Pittaluga S, Wilson WH, Staudt LM. Schmitz R, et al. N Engl J Med. 2018 Apr 12;378(15):1396-1407. doi: 10.1056/NEJMoa1801445. N Engl J Med. 2018. PMID: 29641966 Free PMC article.
  • Diffuse large B-cell lymphoma.
    Li S, Young KH, Medeiros LJ. Li S, et al. Pathology. 2018 Jan;50(1):74-87. doi: 10.1016/j.pathol.2017.09.006. Epub 2017 Nov 20. Pathology. 2018. PMID: 29167021 Review.
  • [Analysis of genomic copy number alterations of malignant lymphomas and its application for diagnosis].
    Tagawa H. Tagawa H. Gan To Kagaku Ryoho. 2007 Jul;34(7):975-82. Gan To Kagaku Ryoho. 2007. PMID: 17637530 Review. Japanese.

Cited by

References

    1. Basso K & Dalla-Favera R Germinal centres and B cell lymphomagenesis. Nat Rev Immunol 15, 172–184 (2015). - PubMed
    1. Monti S, et al. Integrative Analysis Reveals an Outcome-Associated and Targetable Pattern of p53 and Cell Cycle Deregulation in Diffuse Large B Cell Lymphoma. Cancer Cell 22, 359–372 (2012). - PMC - PubMed
    1. Pasqualucci L, et al. Analysis of the coding genome of diffuse large B-cell lymphoma. Nat Genet 43, 830–837 (2011). - PMC - PubMed
    1. Morin RD, et al. Frequent mutation of histone-modifying genes in non-Hodgkin lymphoma. Nature 476, 298–303 (2011). - PMC - PubMed
    1. Lohr JG, et al. Discovery and prioritization of somatic mutations in diffuse large B-cell lymphoma (DLBCL) by whole-exome sequencing. Proc Natl Acad Sci U S A 109, 3879–3884 (2012). - PMC - PubMed

Publication types