

Nonalcoholic steatohepatitis severity is defined by a failure in compensatory antioxidant capacity in the setting of mitochondrial dysfunction
- PMID: 29713129
- PMCID: PMC5922994
- DOI: 10.3748/wjg.v24.i16.1748
Nonalcoholic steatohepatitis severity is defined by a failure in compensatory antioxidant capacity in the setting of mitochondrial dysfunction
Abstract
Aim: To comprehensively evaluate mitochondrial (dys) function in preclinical models of nonalcoholic steatohepatitis (NASH).
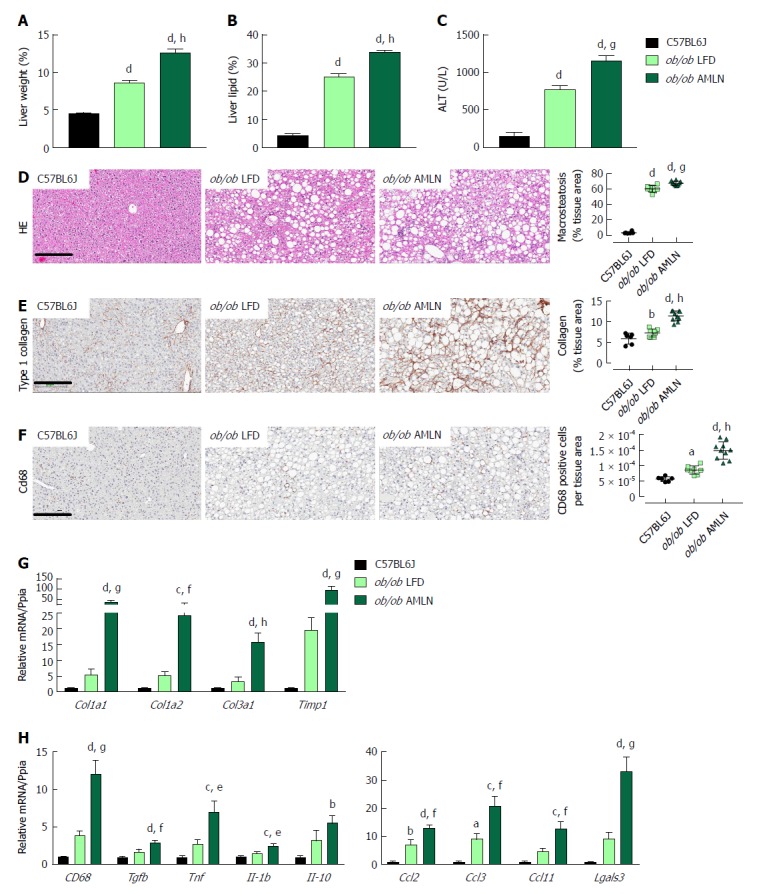
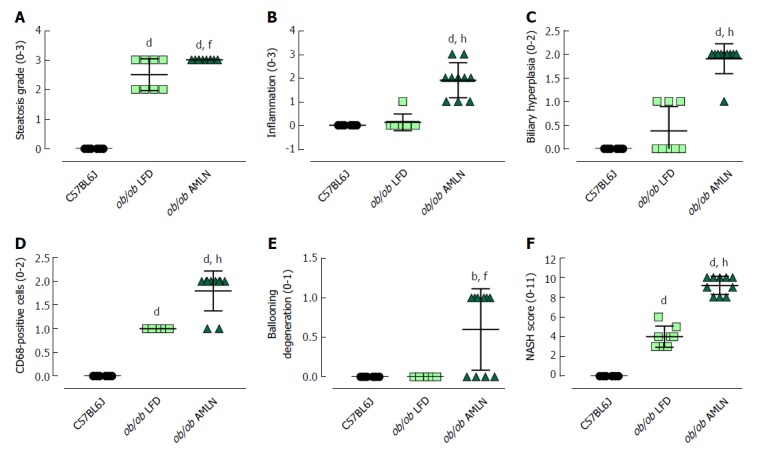
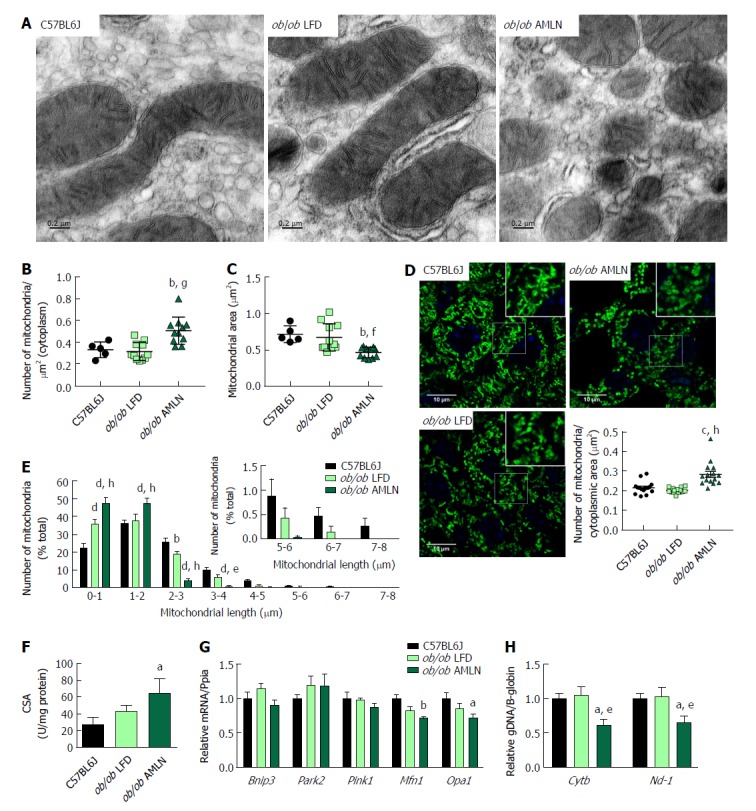
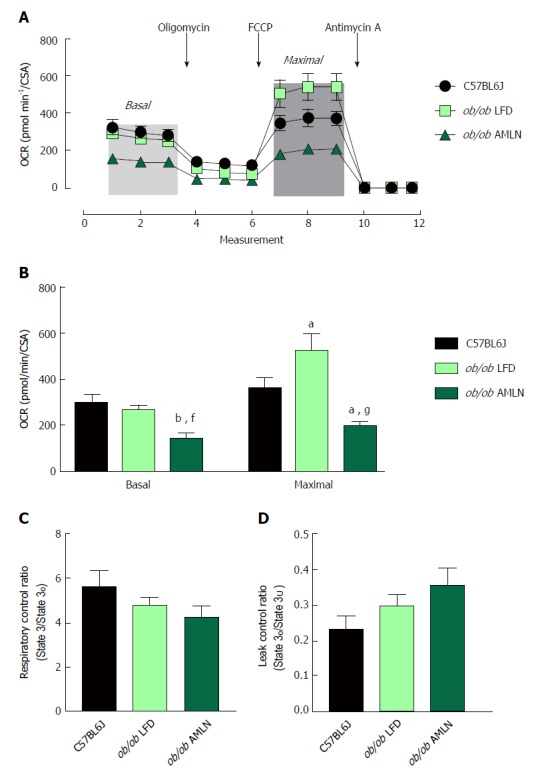
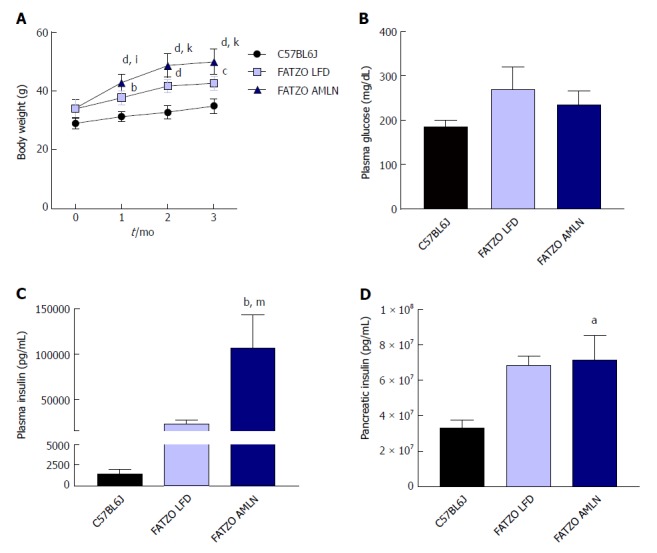
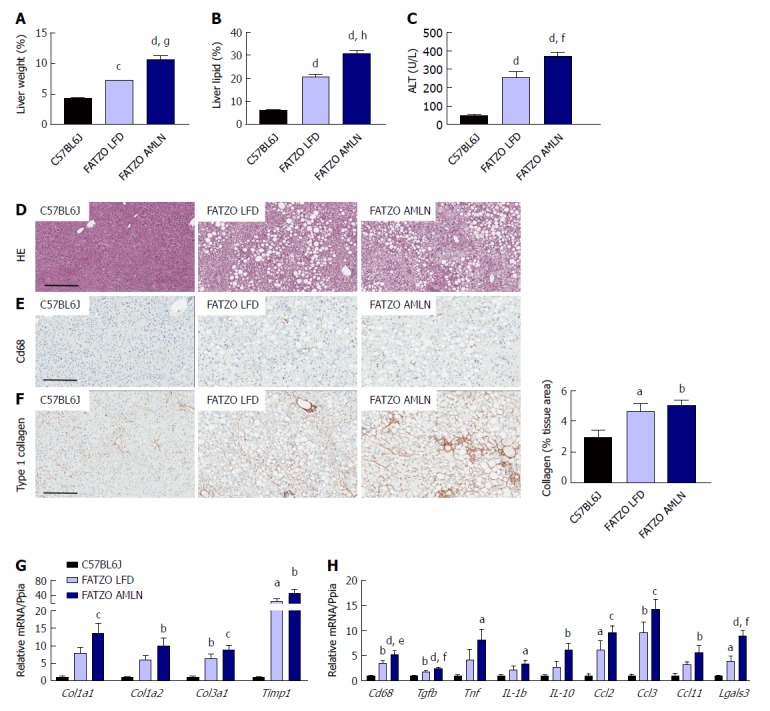
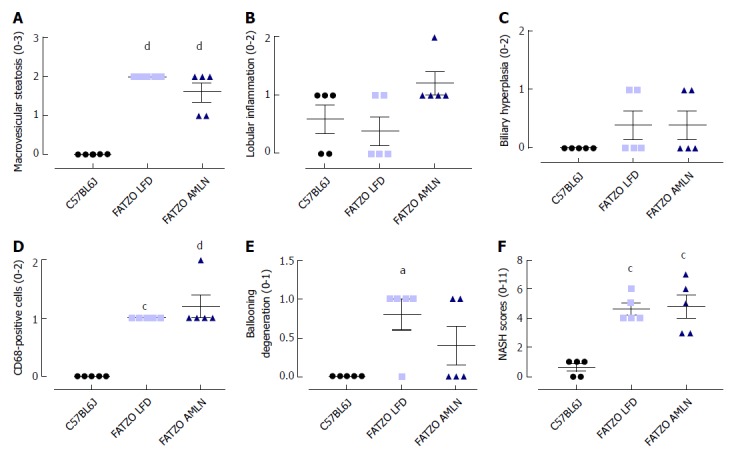
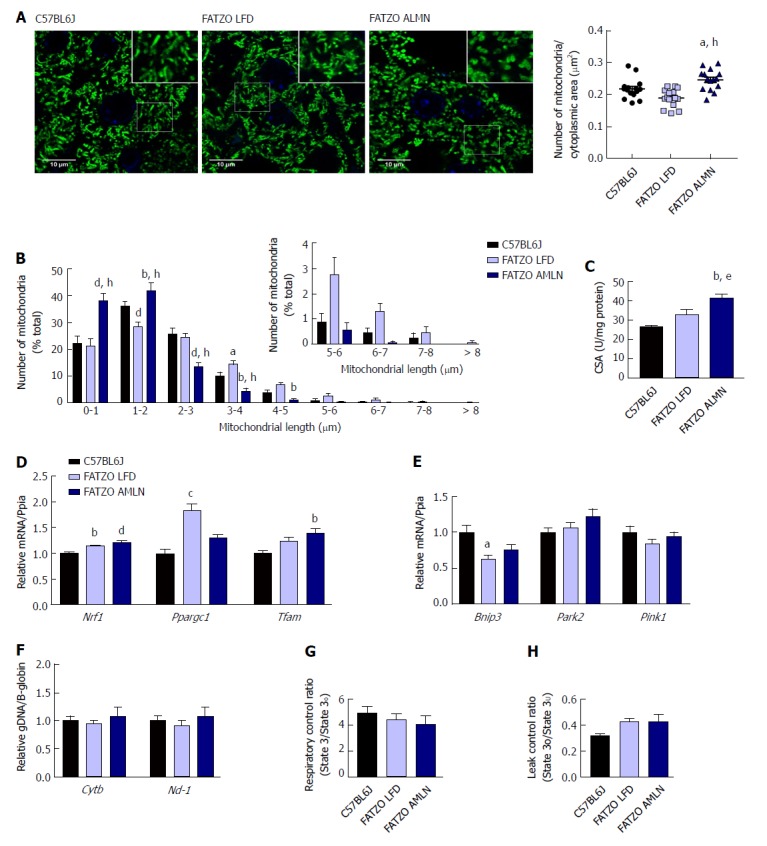
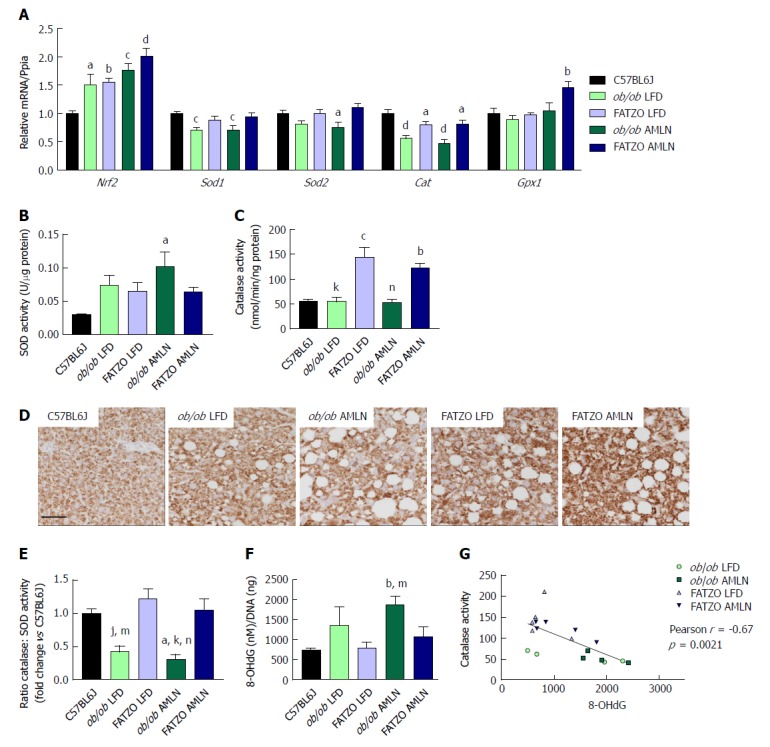
Methods: We utilized two readily available mouse models of nonalcoholic fatty liver disease (NAFLD) with or without progressive fibrosis: Lepob/Lepob (ob/ob) and FATZO mice on high trans-fat, high fructose and high cholesterol (AMLN) diet. Presence of NASH was assessed using immunohistochemical and pathological techniques, and gene expression profiling. Morphological features of mitochondria were assessed via transmission electron microscopy and immunofluorescence, and function was assessed by measuring oxidative capacity in primary hepatocytes, and respiratory control and proton leak in isolated mitochondria. Oxidative stress was measured by assessing activity and/or expression levels of Nrf1, Sod1, Sod2, catalase and 8-OHdG.
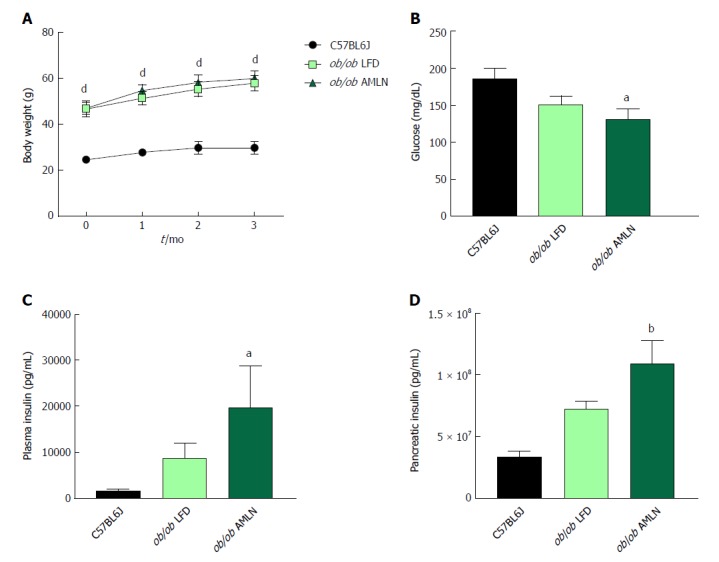
Results: When challenged with AMLN diet for 12 wk, ob/ob and FATZO mice developed steatohepatitis in the presence of obesity and hyperinsulinemia. NASH development was associated with hepatic mitochondrial abnormalities, similar to those previously observed in humans, including mitochondrial accumulation and increased proton leak. AMLN diet also resulted in increased numbers of fragmented mitochondria in both strains of mice. Despite similar mitochondrial phenotypes, we found that ob/ob mice developed more advanced hepatic fibrosis. Activity of superoxide dismutase (SOD) was increased in ob/ob AMLN mice, whereas FATZO mice displayed increased catalase activity, irrespective of diet. Furthermore, 8-OHdG, a marker of oxidative DNA damage, was significantly increased in ob/ob AMLN mice compared to FATZO AMLN mice. Therefore, antioxidant capacity reflected as the ratio of catalase:SOD activity was similar between FATZO and C57BL6J control mice, but significantly perturbed in ob/ob mice.
Conclusion: Oxidative stress, and/or the capacity to compensate for increased oxidative stress, in the setting of mitochondrial dysfunction, is a key factor for development of hepatic injury and fibrosis in these mouse models.
Keywords: Fibrosis; Mitochondrial function; Nonalcoholic steatohepatitis; Oxidative stress; Steatosis.
Conflict of interest statement
Conflict-of-interest statement: All authors are current employees and/or stockholders of MedImmune/AstraZeneca.
Figures
Similar articles
-
INT-767 improves histopathological features in a diet-induced ob/ob mouse model of biopsy-confirmed non-alcoholic steatohepatitis.World J Gastroenterol. 2018 Jan 14;24(2):195-210. doi: 10.3748/wjg.v24.i2.195. World J Gastroenterol. 2018. PMID: 29375205 Free PMC article.
-
Metabolic and hepatic effects of liraglutide, obeticholic acid and elafibranor in diet-induced obese mouse models of biopsy-confirmed nonalcoholic steatohepatitis.World J Gastroenterol. 2018 Jan 14;24(2):179-194. doi: 10.3748/wjg.v24.i2.179. World J Gastroenterol. 2018. PMID: 29375204 Free PMC article.
-
Towards a standard diet-induced and biopsy-confirmed mouse model of non-alcoholic steatohepatitis: Impact of dietary fat source.World J Gastroenterol. 2019 Sep 7;25(33):4904-4920. doi: 10.3748/wjg.v25.i33.4904. World J Gastroenterol. 2019. PMID: 31543682 Free PMC article.
-
Antioxidant Mechanisms in Nonalcoholic Fatty Liver Disease.Curr Drug Targets. 2015;16(12):1301-14. doi: 10.2174/1389450116666150427155342. Curr Drug Targets. 2015. PMID: 25915484 Review.
-
Nonalcoholic Fatty Liver Disease: Basic Pathogenetic Mechanisms in the Progression From NAFLD to NASH.Transplantation. 2019 Jan;103(1):e1-e13. doi: 10.1097/TP.0000000000002480. Transplantation. 2019. PMID: 30300287 Review.
Cited by
-
Atorvastatin impairs liver mitochondrial function in obese Göttingen Minipigs but heart and skeletal muscle are not affected.Sci Rep. 2021 Jan 26;11(1):2167. doi: 10.1038/s41598-021-81846-9. Sci Rep. 2021. PMID: 33500513 Free PMC article.
-
Resolution of NASH and hepatic fibrosis by the GLP-1R/GcgR dual-agonist Cotadutide via modulating mitochondrial function and lipogenesis.Nat Metab. 2020 May;2(5):413-431. doi: 10.1038/s42255-020-0209-6. Epub 2020 May 21. Nat Metab. 2020. PMID: 32478287 Free PMC article.
-
Branched chain amino acids and carbohydrate restriction exacerbate ketogenesis and hepatic mitochondrial oxidative dysfunction during NAFLD.FASEB J. 2020 Nov;34(11):14832-14849. doi: 10.1096/fj.202001495R. Epub 2020 Sep 12. FASEB J. 2020. PMID: 32918763 Free PMC article.
-
A Defective Circulating Mitochondrial Bioenergetics Profile Reflects the Hepatic One and Outlines Genetic MASLD.Antioxidants (Basel). 2025 May 22;14(6):618. doi: 10.3390/antiox14060618. Antioxidants (Basel). 2025. PMID: 40563253 Free PMC article.
-
Rhamnetin ameliorates non-alcoholic steatosis and hepatocellular carcinoma in vitro.Mol Cell Biochem. 2023 Aug;478(8):1689-1704. doi: 10.1007/s11010-022-04619-6. Epub 2022 Dec 10. Mol Cell Biochem. 2023. PMID: 36495373 Free PMC article.
References
-
- Younossi ZM, Blissett D, Blissett R, Henry L, Stepanova M, Younossi Y, Racila A, Hunt S, Beckerman R. The economic and clinical burden of nonalcoholic fatty liver disease in the United States and Europe. Hepatology. 2016;64:1577–1586. - PubMed
-
- Younossi ZM, Koenig AB, Abdelatif D, Fazel Y, Henry L, Wymer M. Global epidemiology of nonalcoholic fatty liver disease-Meta-analytic assessment of prevalence, incidence, and outcomes. Hepatology. 2016;64:73–84. - PubMed
-
- Kabbany MN, Conjeevaram Selvakumar PK, Watt K, Lopez R, Akras Z, Zein N, Carey W, Alkhouri N. Prevalence of Nonalcoholic Steatohepatitis-Associated Cirrhosis in the United States: An Analysis of National Health and Nutrition Examination Survey Data. Am J Gastroenterol. 2017;112:581–587. - PubMed
MeSH terms
Substances
LinkOut - more resources
Full Text Sources
Other Literature Sources
Medical
Molecular Biology Databases
Miscellaneous
