

Identification of potential prognostic microRNA biomarkers for predicting survival in patients with hepatocellular carcinoma
- PMID: 29713196
- PMCID: PMC5912208
- DOI: 10.2147/CMAR.S161334
Identification of potential prognostic microRNA biomarkers for predicting survival in patients with hepatocellular carcinoma
Abstract
Background: The aim of the present study was to identify potential prognostic microRNA (miRNA) biomarkers for hepatocellular carcinoma (HCC) prognosis prediction based on a dataset from The Cancer Genome Atlas (TCGA).
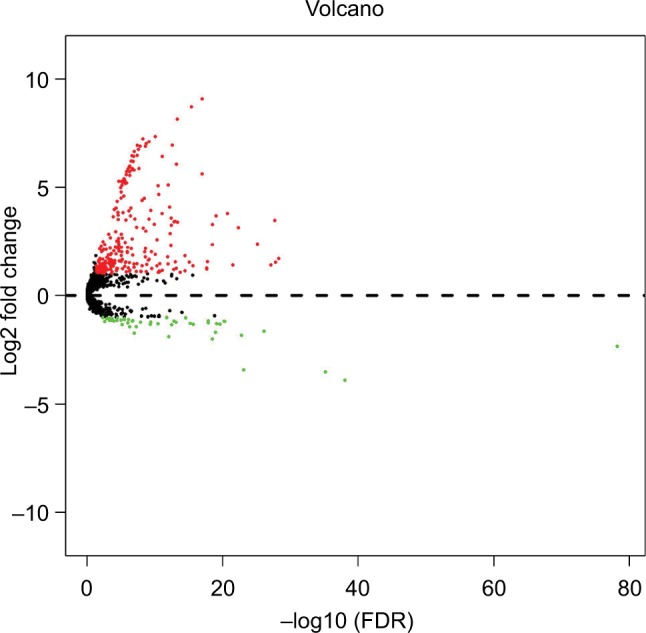
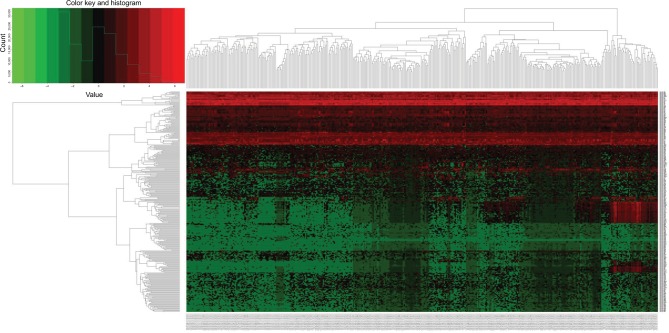
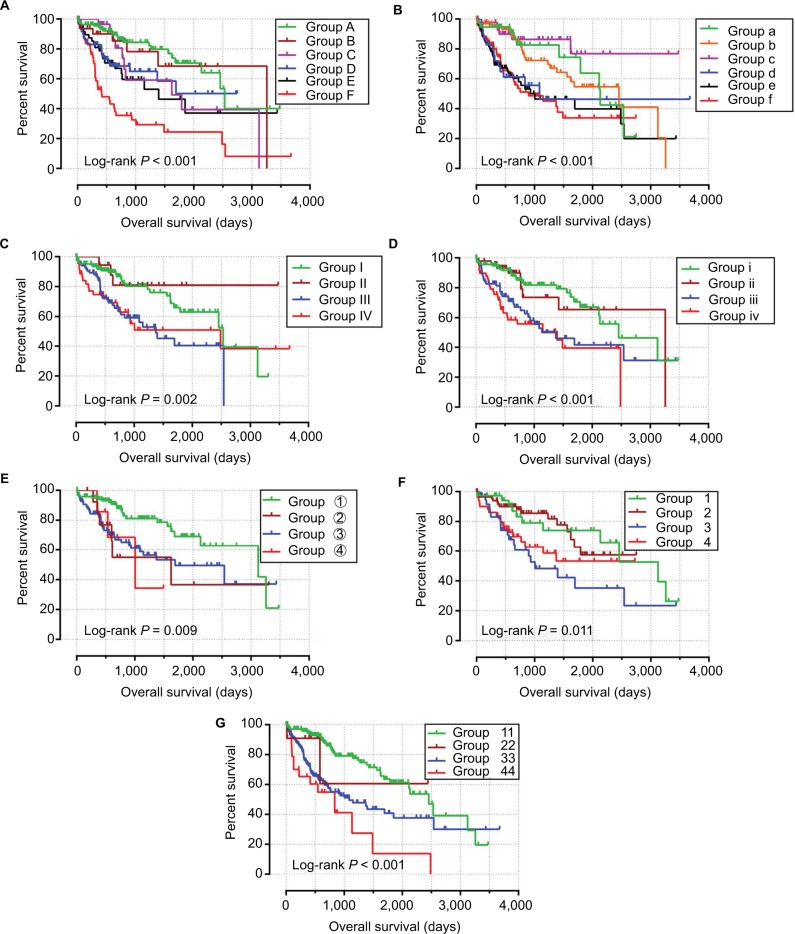
Materials and methods: A miRNA sequencing dataset and corresponding clinical parameters of HCC were obtained from TCGA. Genome-wide univariate Cox regression analysis was used to screen prognostic differentially expressed miRNAs (DEMs), and multivariable Cox regression analysis was used for prognostic signature construction. Comprehensive survival analysis was performed to evaluate the prognostic value of the prognostic signature.
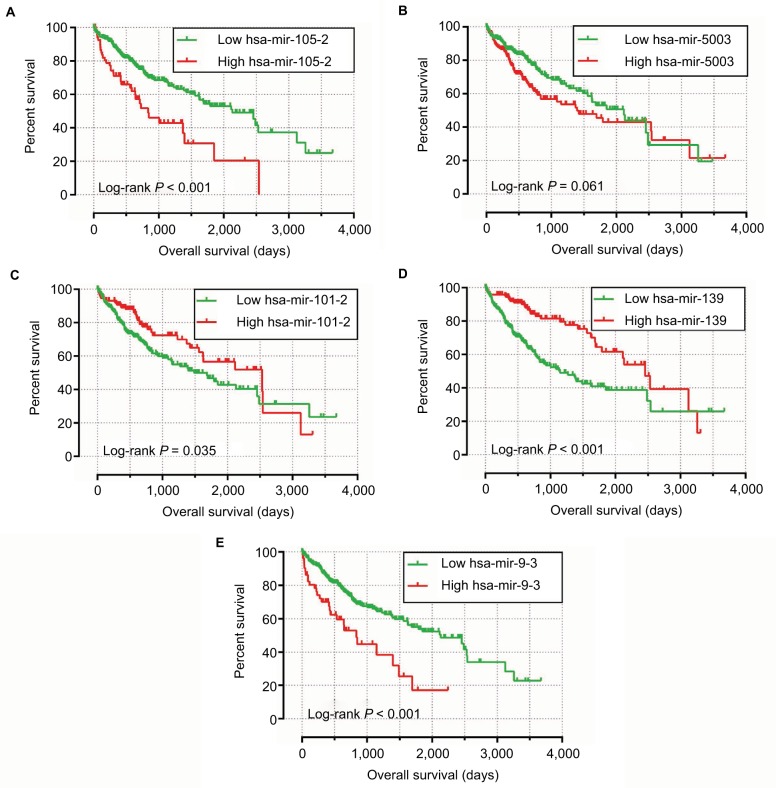
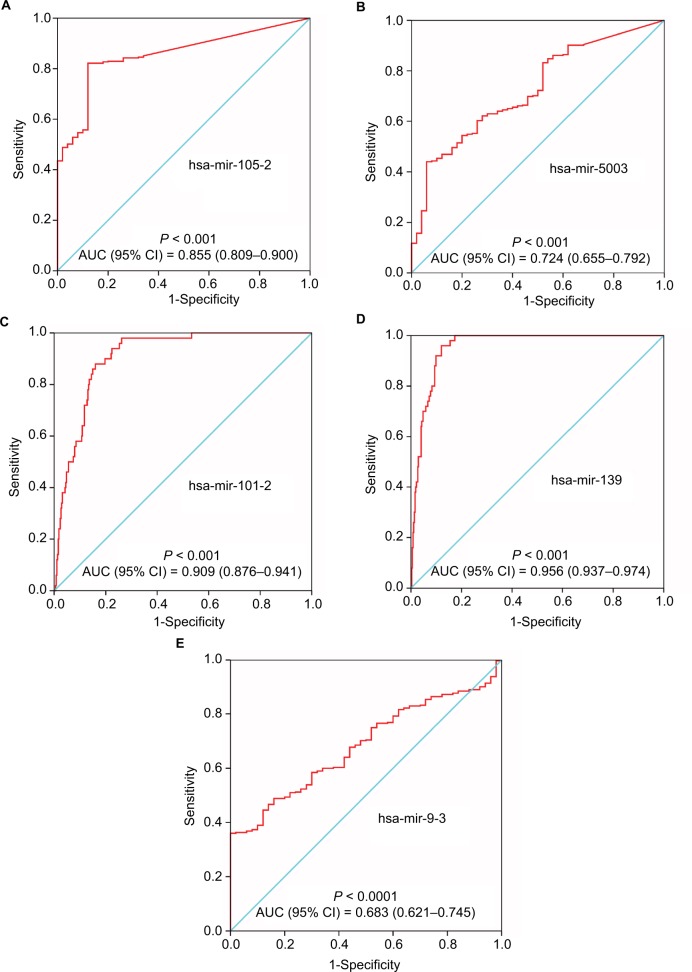
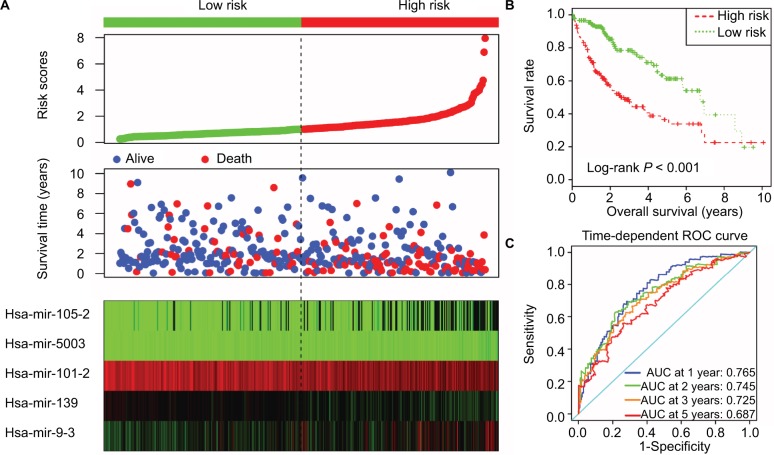
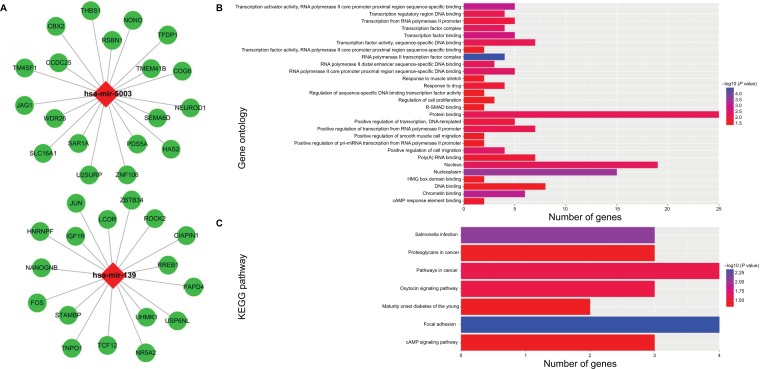
Results: Five miRNAs were regarded as prognostic DEMs and used for prognostic signature construction. The five-DEM prognostic signature performed well in prognosis prediction (adjusted P < 0.0001, adjusted hazard ratio = 2.249, 95% confidence interval =1.491-3.394), and time-dependent receiver-operating characteristic (ROC) analysis showed an area under the curve (AUC) of 0.765, 0.745, 0.725, and 0.687 for 1-, 2-, 3-, and 5-year HCC overall survival (OS) prediction, respectively. Comprehensive survival analysis of the prognostic signature suggests that the risk score model could serve as an independent factor of HCC and perform better in prognosis prediction than other traditional clinical indicators. Functional assessment of the target genes of hsa-mir-139 and hsa-mir-5003 indicates that they were significantly enriched in multiple biological processes and pathways, including cell proliferation and cell migration regulation, pathways in cancer, and the cyclic adenosine monophosphate (cAMP) signaling pathway.
Conclusion: Our study indicates that the novel miRNA expression signature may be a potential prognostic biomarker for HCC patients.
Keywords: TCGA; biomarker; hepatocellular carcinoma; miRNA; prognosis.
Conflict of interest statement
Disclosure The authors report no conflicts of interest in this work.
Figures
Similar articles
-
Genome-scale analysis to identify prognostic microRNA biomarkers in patients with early stage pancreatic ductal adenocarcinoma after pancreaticoduodenectomy.Cancer Manag Res. 2018 Aug 10;10:2537-2551. doi: 10.2147/CMAR.S168351. eCollection 2018. Cancer Manag Res. 2018. PMID: 30127641 Free PMC article.
-
Identification of Potential Prognostic Long Non-Coding RNA Biomarkers for Predicting Survival in Patients with Hepatocellular Carcinoma.Cell Physiol Biochem. 2018;48(5):1854-1869. doi: 10.1159/000492507. Epub 2018 Aug 9. Cell Physiol Biochem. 2018. PMID: 30092592
-
Genome-wide analysis to identify a novel microRNA signature that predicts survival in patients with stomach adenocarcinoma.J Cancer. 2019 Oct 17;10(25):6298-6313. doi: 10.7150/jca.33250. eCollection 2019. J Cancer. 2019. PMID: 31772663 Free PMC article.
-
Bioinformatic analysis and in vitro validation of a five-microRNA signature as a prognostic biomarker of hepatocellular carcinoma.Ann Transl Med. 2020 Nov;8(21):1422. doi: 10.21037/atm-20-2509. Ann Transl Med. 2020. PMID: 33313167 Free PMC article.
-
Evaluating the Prognostic Accuracy of Biomarkers for Glioblastoma Multiforme Using The Cancer Genome Atlas Data.Cancer Inform. 2017 Dec 13;16:1176935117734844. doi: 10.1177/1176935117734844. eCollection 2017. Cancer Inform. 2017. PMID: 35173406 Free PMC article. Review.
Cited by
-
Identification of Prognostic Immune-Related Genes in Pancreatic Adenocarcinoma and Establishment of a Prognostic Nomogram: A Bioinformatic Study.Biomed Res Int. 2020 Jun 9;2020:1346045. doi: 10.1155/2020/1346045. eCollection 2020. Biomed Res Int. 2020. PMID: 32596278 Free PMC article.
-
Distinct Diagnostic and Prognostic Values of Minichromosome Maintenance Gene Expression in Patients with Hepatocellular Carcinoma.J Cancer. 2018 Jun 12;9(13):2357-2373. doi: 10.7150/jca.25221. eCollection 2018. J Cancer. 2018. PMID: 30026832 Free PMC article.
-
Discovering the 'Dark matters' in expression data of miRNA based on the miRNA-mRNA and miRNA-lncRNA networks.BMC Bioinformatics. 2018 Oct 16;19(1):379. doi: 10.1186/s12859-018-2410-0. BMC Bioinformatics. 2018. PMID: 30326837 Free PMC article.
-
Comprehensive investigation of key biomarkers and pathways in hepatitis B virus-related hepatocellular carcinoma.J Cancer. 2019 Sep 7;10(23):5689-5704. doi: 10.7150/jca.31287. eCollection 2019. J Cancer. 2019. PMID: 31737106 Free PMC article.
-
Clinical significance and prospective molecular mechanism of C‑C motif chemokine receptors in patients with early‑stage pancreatic ductal adenocarcinoma after pancreaticoduodenectomy.Oncol Rep. 2019 Nov;42(5):1856-1868. doi: 10.3892/or.2019.7277. Epub 2019 Aug 13. Oncol Rep. 2019. PMID: 31432181 Free PMC article.
References
-
- Chen W, Zheng R, Baade PD, et al. Cancer statistics in China, 2015. CA Cancer J Clin. 2016;66(2):115–132. - PubMed
-
- Tang D, Nagano H, Nakamura M, et al. Clinical and pathological features of Allen’s type C classification of resected combined hepatocellular and cholangiocarcinoma: a comparative study with hepatocellular carcinoma and cholangiocellular carcinoma. J Gastrointest Surg. 2006;10(7):987–998. - PubMed
-
- Klingenberg M, Matsuda A, Diederichs S, Patel T. Non-coding RNA in hepatocellular carcinoma: mechanisms, biomarkers and therapeutic targets. J Hepatol. 2017;67(3):603–618. - PubMed
LinkOut - more resources
Full Text Sources
Other Literature Sources
