. 2018 Apr 16:9:312.
doi: 10.3389/fphys.2018.00312. eCollection 2018.

Transcriptional Repression and Protein Degradation of the Ca2+-Activated K+ Channel KCa1.1 by Androgen Receptor Inhibition in Human Breast Cancer Cells

Affiliations

Transcriptional Repression and Protein Degradation of the Ca2+-Activated K+ Channel KCa1.1 by Androgen Receptor Inhibition in Human Breast Cancer Cells

Anowara Khatun et al. Front Physiol. .

Abstract

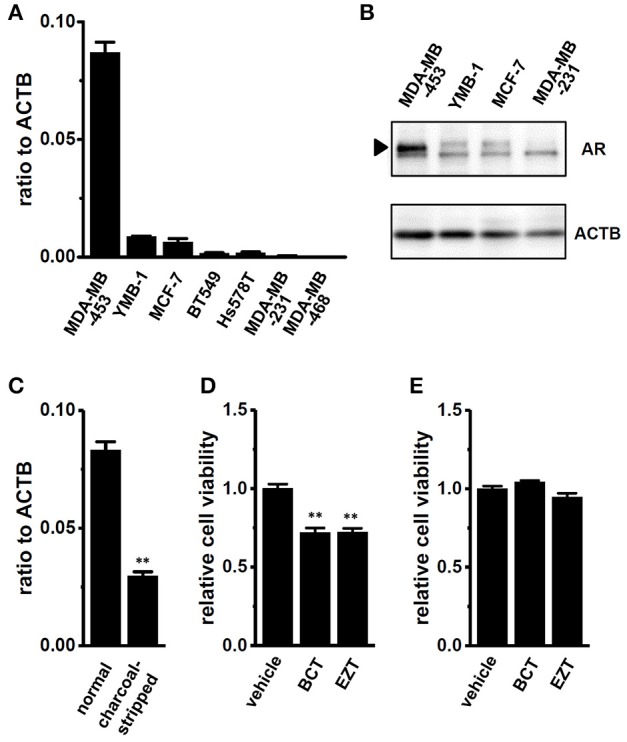
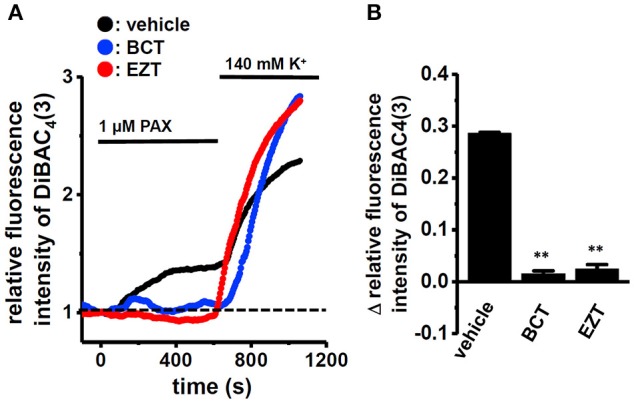
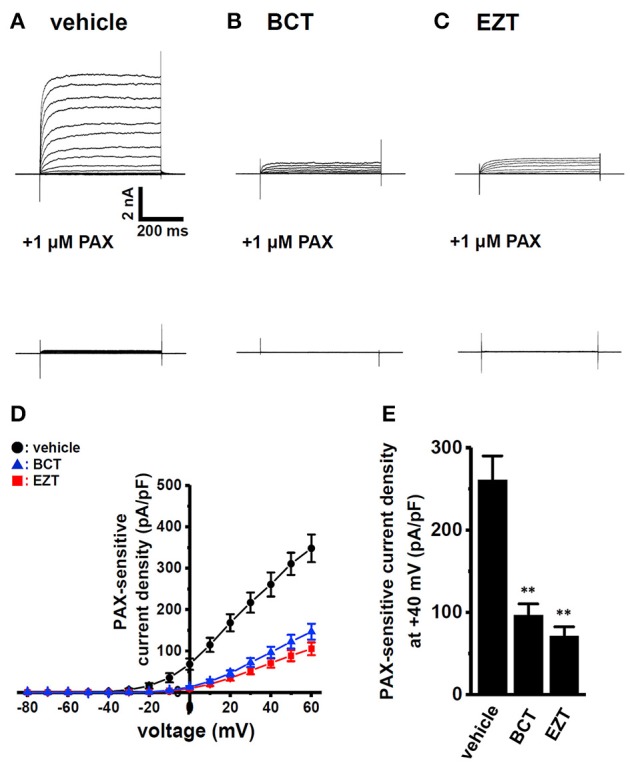
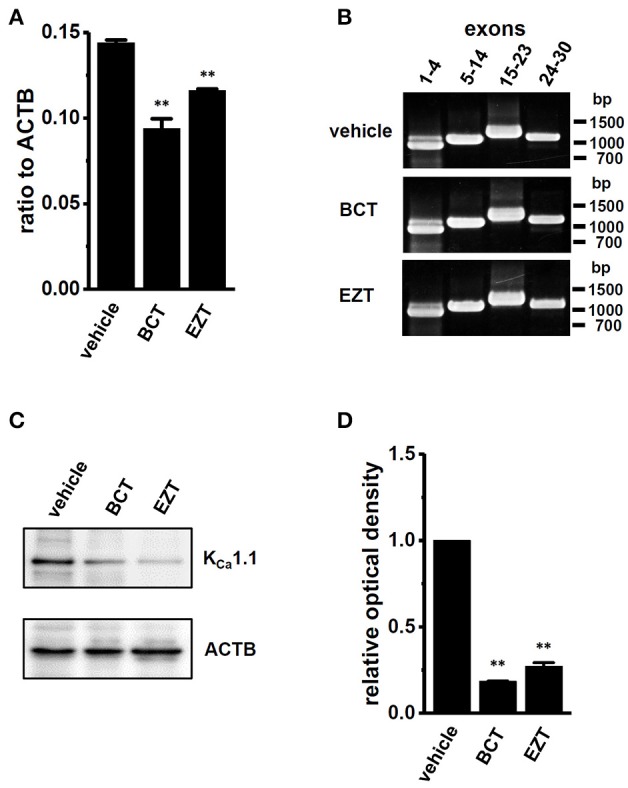
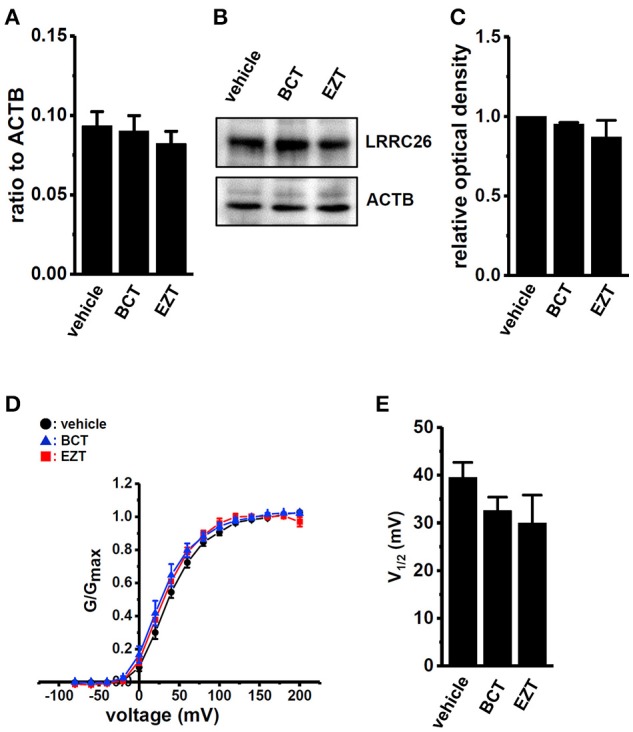
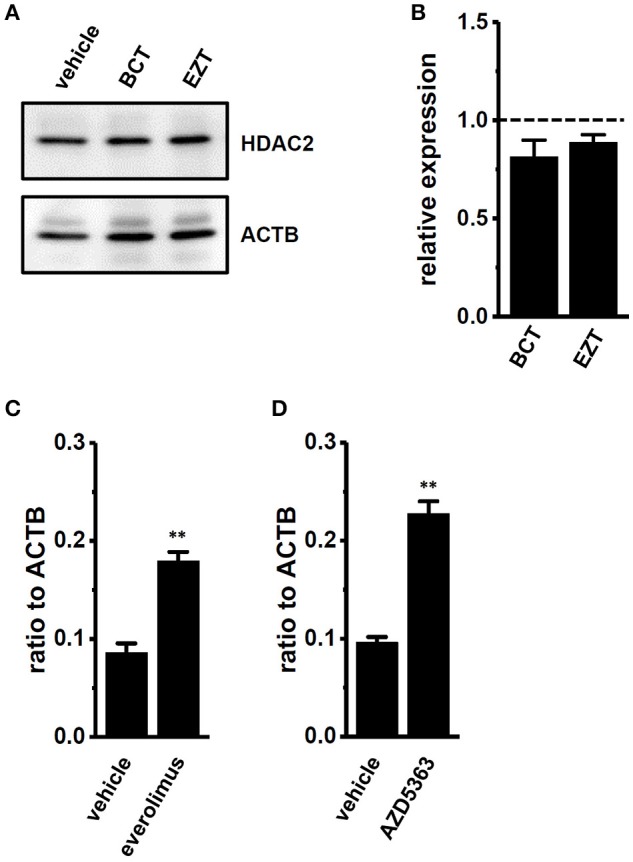
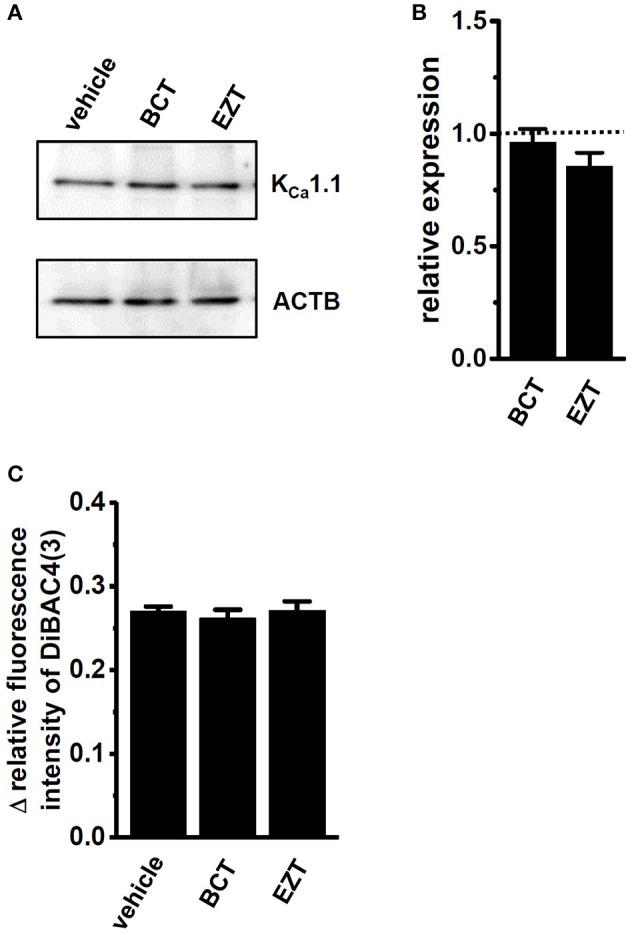
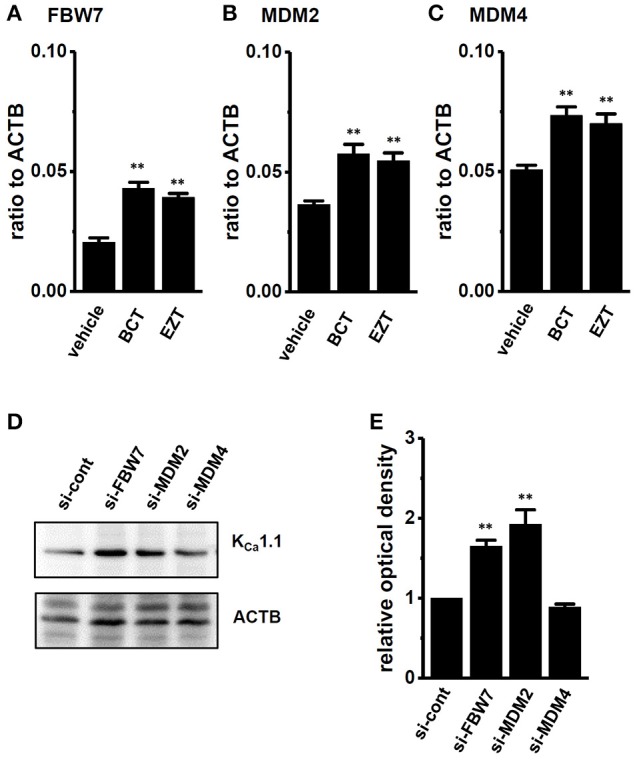
The large-conductance Ca2+-activated K+ channel KCa1.1 plays an important role in the promotion of breast cancer cell proliferation and metastasis. The androgen receptor (AR) is proposed as a therapeutic target for AR-positive advanced triple-negative breast cancer. We herein investigated the effects of a treatment with antiandrogens on the functional activity, activation kinetics, transcriptional expression, and protein degradation of KCa1.1 in human breast cancer MDA-MB-453 cells using real-time PCR, Western blotting, voltage-sensitive dye imaging, and whole-cell patch clamp recording. A treatment with the antiandrogen bicalutamide or enzalutamide for 48 h significantly suppressed (1) depolarization responses induced by paxilline (PAX), a specific KCa1.1 blocker and (2) PAX-sensitive outward currents induced by the depolarizing voltage step. The expression levels of KCa1.1 transcripts and proteins were significantly decreased in MDA-MB-453 cells, and the protein degradation of KCa1.1 mainly contributed to reductions in KCa1.1 activity. Among the eight regulatory β and γ subunits, LRRC26 alone was expressed at high levels in MDA-MB-453 cells and primary and metastatic breast cancer tissues, whereas no significant changes were observed in the expression levels of LRRC26 and activation kinetics of PAX-sensitive outward currents in MDA-MB-453 cells by the treatment with antiandrogens. The treatment with antiandrogens up-regulated the expression of the ubiquitin E3 ligases, FBW7, MDM2, and MDM4 in MDA-MB-453 cells, and the protein degradation of KCa1.1 was significantly inhibited by the respective siRNA-mediated blockade of FBW7 and MDM2. Based on these results, we concluded that KCa1.1 is an androgen-responsive gene in AR-positive breast cancer cells, and its down-regulation through enhancements in its protein degradation by FBW7 and/or MDM2 may contribute, at least in part, to the antiproliferative and antimetastatic effects of antiandrogens in breast cancer cells.

Keywords: Ca2+-activated K+ channel; KCa1.1; androgen receptor; antiandrogen; breast cancer; ubiquitin E3 ligase.


Figures

Figure 1
Figure 1
Gene and protein expression of the androgen receptor (AR) in human breast cancer cell lines and effects of antiandrogens on the viability of MDA-MB-453 cells. (A) Real-time PCR assay for AR in seven human breast cancer cell lines (n = 3 for each). (B) Expression of AR proteins (approximately 110 kDa) in MDA-MB-453, YMB-1, MCF-7, and MDA-MB-231 cells. Protein lysates of the examined cells were probed by immunoblotting with anti-AR (upper panel) and anti-ACTB (lower panel) antibodies on the same filter. (C) Expression of AR transcripts in MDA-MB-453 cells cultivated for 5 days with normal FBS- and charcoal-stripped FBS-supplemented (10%) medium (n = 4 for each). (D,E) Effects of treatments with the antiandrogens, bicalutamide (BCT, 1 μM) and enzalutamide (EZT, 1 μM) for 72 h on the viability of MDA-MB-453 cells pre-cultivated for 5 days with normal FCS- (D) and charcoal-stripped FCS- (E) supplemented medium. The viability of vehicle-treated cells is arbitrarily expressed as 1.0, and data are shown as “relative cell viability” (n = 5 for each). Expression levels were expressed as a ratio to ACTB (A,C). Results were expressed as means ± SEM. **p <0.01 vs. the normal FBS group or vehicle control.
Figure 2
Figure 2
Effects of treatments with antiandrogens for 48 h on 1 μM paxilline (PAX)-induced depolarization responses in MDA-MB-453 cells. (A) Measurement of PAX-induced depolarization responses in vehicle (black symbols)-, BCT (blue symbols)-, and EZT (red symbols)-treated MDA-MB-453 cells. The fluorescence intensity of DiBAC4(3) before the application of PAX at 0 s is expressed as 1.0. The time courses of changes in the relative fluorescence intensity of DiBAC4(3) are shown. (B) Summarized data are shown as the PAX-induced Δ relative fluorescence intensity of DiBAC4(3) in vehicle-, BCT-, and EZT-treated MDA-MB-453 cells. Cells were obtained from three different batches (59, 60, and 47 cells in each group). Results were expressed as means ± SEM. **p <0.01 vs. the vehicle control.
Figure 3
Figure 3
Effects of treatments with antiandrogens for 48 h on paxilline-sensitive outward K+ currents in MDA-MB-453 cells. (A–C) Currents were elicited by a 500-ms depolarizing voltage step between −80 and +60 mV from a holding potential (−60 mV) with 10-mV increments in MDA-MD-453 cells treated with vehicle (A, upper panel), 1 μM BCT (B, upper panel), and 1 μM EZT (C, upper panel). The application of 1 μM PAX reduced outward currents (A–C, lower panel). (D) Current density-voltage relationship for PAX-sensitive peak current amplitude. (E) Summarized data on PAX-sensitive current density at +40 mV in vehicle- (n = 10), BCT- (n = 10), and EZT- (n = 11) treated MDA-MB-453 cells. Results are expressed as means ± SEM. **p <0.01 vs. the vehicle control.
Figure 4
Figure 4
Down-regulation of KCa1.1 transcripts and proteins in MDA-MB-453 cells by treatments with antiandrogens for 48 h. (A) Real-time PCR assay for KCa1.1 in vehicle-, 1 μM BCT-, and 1 μM EZT-treated MDA-MB-453 cells (n = 4 for each). Expression levels were expressed as a ratio to ACTB. (B) Band patterns on agarose gels for the PCR products of KCa1.1 exons (exons 1–4, 5–14, 15–23, and 24–30) in vehicle-, 1 μM BCT-, and 1 μM EZT-treated MDA-MB-453 cells. A DNA molecular weight marker is indicated on the right of the gel. (C) Protein lysates of vehicle-, 1 μM BCT-, and 1 μM EZT-treated MDA-MB-453 cells were probed by immunoblotting with anti-KCa1.1 (upper panel) and anti-ACTB (lower panel) antibodies on the same filter. (D) Summarized results were obtained as the optical density of KCa1.1 and ACTB band signals. After compensation for the optical density of the KCa1.1 protein band signal with that of the ACTB signal, the KCa1.1 signal in the vehicle control was expressed as 1.0 (n = 3 for each). Results are expressed as means ± SEM. **p <0.01 vs. the vehicle control.
Figure 5
Figure 5
Effects of treatments with antiandrogens on expression levels of the KCa1.1 regulatory γ subunit, LRRC26 transcripts and proteins and on the voltage dependency of KCa1.1 currents in MDA-MB-453 cells. (A) Real-time PCR assay for LRRC26 in vehicle-, 1 μM BCT-, and 1 μM EZT-treated MDA-MB-453 cells (n = 4 for each). Expression levels were expressed as a ratio to ACTB. (B) Protein lysates of vehicle-, 1 μM BCT-, and 1 μM EZT-treated MDA-MB-453 cells were probed by immunoblotting with anti-LRRC26 (upper panel) and anti-ACTB (lower panel) antibodies on the same filter. (C) Summarized results were obtained as the optical density of LRRC26 and ACTB band signals. After compensation for the optical density of the LRRC26 protein band signal with that of the ACTB signal, the LRRC26 signal in the vehicle control was expressed as 1.0 (n = 4 for each).(D) The voltage dependency of activation curves was derived from the current (I)-voltage (V) relationship in vehicle- (n = 13), BCT- (n = 9), and EZT- (n = 9) treated MDA-MB-453 cells. I–V curves were obtained using the protocol with pulses to potentials ranging between −80 mV and +200 mV for 30 ms, followed by a voltage step to −60 mV for 100 ms. The peak current measured at each potential was divided by (V-Vrev), where V is the test potential and Vrev is the reversal potential. Conductance was then normalized and fit to a standard Boltzmann equation. (E) Summarized data of the half-maximal voltage (V1/2) of activation. Results were expressed as means ± SEM.
Figure 6
Figure 6
Effects of treatments with antiandrogens on expression levels of histone deacetylase (HDAC) 2 proteins and effects of mTOR and AKT inhibitors on expression levels of KCa1.1 transcripts in MDA-MB-453 cells. (A) Protein lysates of vehicle-, 1 μM BCT-, and 1 μM EZT-treated MDA-MB-453 cells were probed by immunoblotting with anti-HDAC2 (upper panel) and anti-ACTB (lower panel) antibodies on the same filter. (B) Summarized results were obtained as the optical density of HDAC2 and ACTB band signals. After compensation for the optical density of the HDAC2 protein band signal with that of the ACTB signal, the HDAC2 signal in the vehicle control was expressed as 1.0 (dotted line, n = 4 for each). (C,D) Real-time PCR assay for KCa1.1 in vehicle-, 10 nM everolimus- (C), and 1 μM AZD5363 (D)-treated MDA-MB-453 cells (n = 4 for each). Expression levels were expressed as a ratio to ACTB. Results are expressed as means ± SEM. **p <0.01 vs. the vehicle control.
Figure 7
Figure 7
Effects of the potent proteasome inhibitor, MG132 (100 nM) in the presence of 10 nM DHT on expression levels of KCa1.1 proteins in antiandrogen-treated MDA-MB-453 cells. MG132 was applied 24 h after the treatment with antiandrogens. (A) Protein lysates of vehicle-, 1 μM BCT-, and 1 μM EZT-treated MDA-MB-453 cells were probed by immunoblotting with anti-KCa1.1 (upper panel) and anti-ACTB (lower panel) antibodies on the same filter. (B) Summarized results were obtained as the optical density of KCa1.1 and ACTB band signals. After compensation for the optical density of the KCa1.1 protein band signal with that of the ACTB signal, the KCa1.1 signal in the vehicle control was expressed as 1.0 (dotted line, n = 3 for each). (C) Measurement of PAX-induced depolarization responses in vehicle-, BCT-, and EZT-treated MDA-MB-453 cells. Summarized data are shown as the PAX-induced Δ relative fluorescence intensity of DiBAC4(3) in vehicle-, BCT-, and EZT-treated MDA-MB-453 cells. Cells were obtained from three different batches (64, 43, and 35 cells in each group). Results were expressed as means ± SEM.
Figure 8
Figure 8
Effects of treatments with antiandrogens on expression levels of ubiquitin E3 ligases, FBW7, MDM2, and MDM4 transcripts and effects of the siRNA-mediated inhibition of ubiquitin E3 ligases on expression levels of KCa1.1 proteins in MDA-MB-453 cells. (A–C) Real-time PCR assay for FBW7 (A), MDM2 (B), and MDM4 (C) in vehicle-, 1 μM BCT-, and 1 μM EZT-treated MDA-MB-453 cells (n = 4 for each). (D) Protein lysates of FBW7, MDM2, and MDM4 siRNA-transfected MDA-MB-453 cells (for 72 h) were probed by immunoblotting with anti-KCa1.1 (upper panel) and anti-ACTB (lower panel) antibodies on the same filter. (E) Summarized results were obtained as the optical density of KCa1.1 and ACTB band signals. After compensation for the optical density of the KCa1.1 protein band signal with that of the ACTB signal, the KCa1.1 signal in the vehicle control was expressed as 1.0 (n = 4 for each). Expression levels were expressed as a ratio to ACTB. Results are expressed as means ± SEM. **p <0.01 vs. the vehicle control or control siRNA (si-cont).

Similar articles

Cited by

References

    1. Altintas D. M., Allioli N., Decaussin M., de Bernard S., Ruffion A., Samarut J., et al. (2013). Differentially expressed androgen-regulated genes in androgen-sensitive tissues reveal potential biomarkers of early prostate cancer. PLoS ONE 8:e66278. 10.1371/journal.pone.0066278 - DOI - PMC - PubMed
    1. Bell T. J., Miyashiro K. Y., Sul J. Y., Buckley P. T., Lee M. T., Mcullough R., et al. (2010). Intron retention facilitates splice variant diversity in calcium-activated big potassium channel populations. Proc. Natl. Acad. Sci. U.S.A. 107, 21152–21157. 10.1073/pnas.1015264107 - DOI - PMC - PubMed
    1. Chen S. P., Liu B. X., Xu J., Pei X. F., Liao Y. J., Yuan F., et al. (2015). MiR-449a suppresses the epithelial-mesenchymal transition and metastasis of hepatocellular carcinoma by multiple targets. BMC Cancer. 15:706 10.1186/s12885-015-1738-3 - DOI - PMC - PubMed
    1. Cheng Y. Y., Wright C. M., Kirschner M. B., Williams M., Sarun K. H., Sytnyk V., et al. (2016). KCa1.1, a calcium-activated potassium channel subunit alpha 1, is targeted by miR-17-5p and modulates cell migration in malignant pleural mesothelioma. Mol. Cancer 15:44 10.1186/s12943-016-0529-z - DOI - PMC - PubMed
    1. Cochrane D. R., Bernales S., Jacobsen B. M., Cittelly D. M., Howe E. N., D'Amato N. C., et al. (2014). Role of the androgen receptor in breast cancer and preclinical analysis of enzalutamide. Breast Cancer Res. 16:R7. 10.1186/bcr3599 - DOI - PMC - PubMed