

3D Fluid-Structure Interaction Simulation of Aortic Valves Using a Unified Continuum ALE FEM Model
- PMID: 29713288
- PMCID: PMC5911501
- DOI: 10.3389/fphys.2018.00363
3D Fluid-Structure Interaction Simulation of Aortic Valves Using a Unified Continuum ALE FEM Model
Abstract
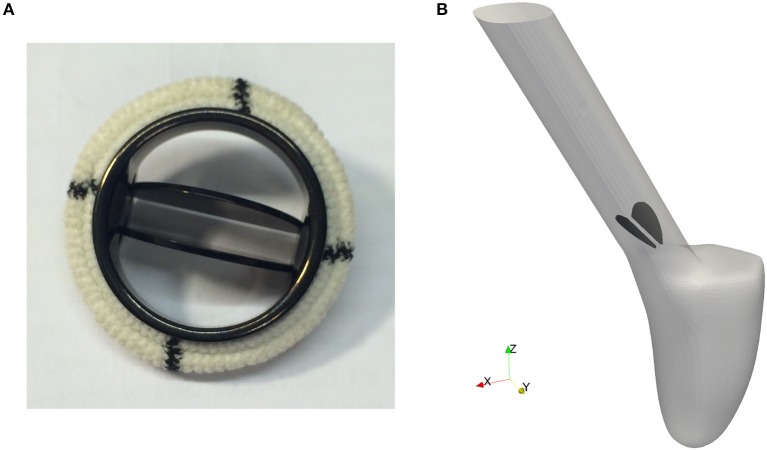
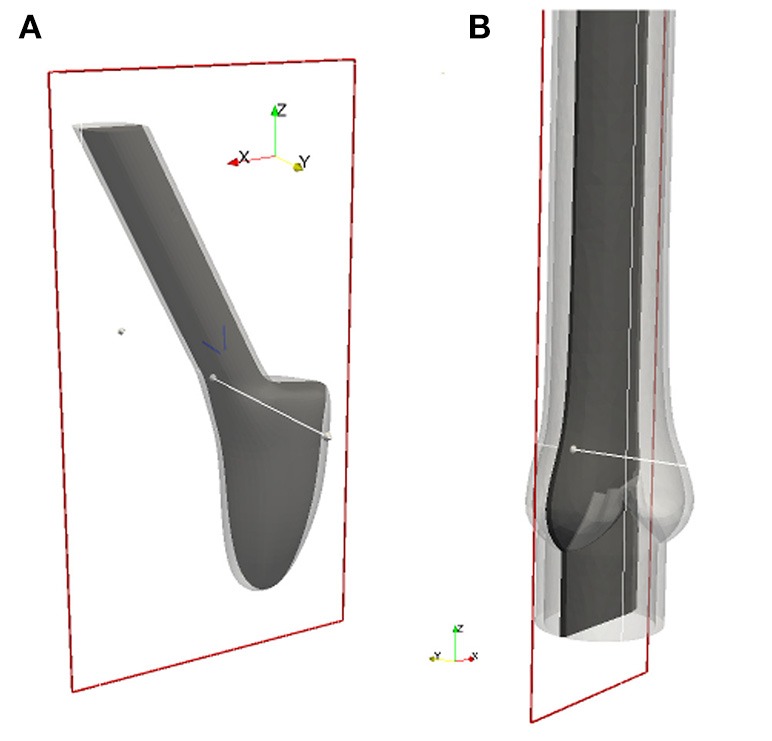
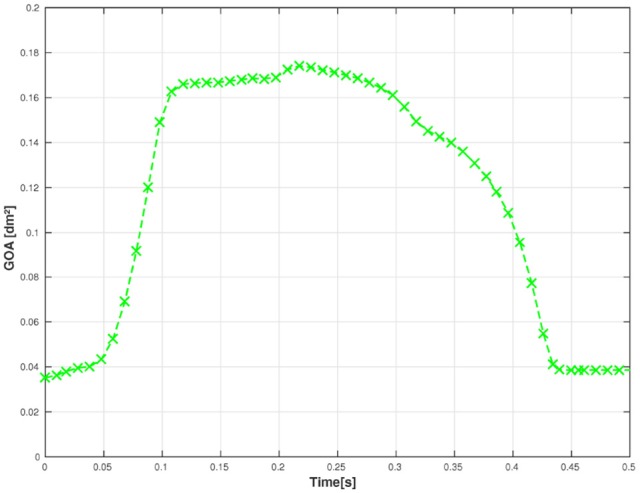
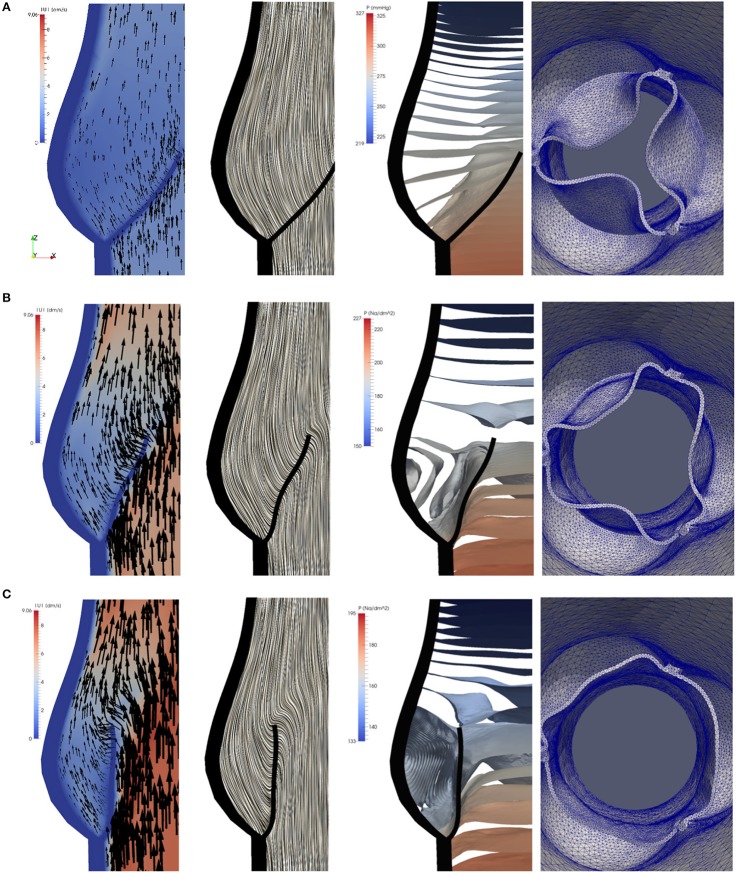
Due to advances in medical imaging, computational fluid dynamics algorithms and high performance computing, computer simulation is developing into an important tool for understanding the relationship between cardiovascular diseases and intraventricular blood flow. The field of cardiac flow simulation is challenging and highly interdisciplinary. We apply a computational framework for automated solutions of partial differential equations using Finite Element Methods where any mathematical description directly can be translated to code. This allows us to develop a cardiac model where specific properties of the heart such as fluid-structure interaction of the aortic valve can be added in a modular way without extensive efforts. In previous work, we simulated the blood flow in the left ventricle of the heart. In this paper, we extend this model by placing prototypes of both a native and a mechanical aortic valve in the outflow region of the left ventricle. Numerical simulation of the blood flow in the vicinity of the valve offers the possibility to improve the treatment of aortic valve diseases as aortic stenosis (narrowing of the valve opening) or regurgitation (leaking) and to optimize the design of prosthetic heart valves in a controlled and specific way. The fluid-structure interaction and contact problem are formulated in a unified continuum model using the conservation laws for mass and momentum and a phase function. The discretization is based on an Arbitrary Lagrangian-Eulerian space-time finite element method with streamline diffusion stabilization, and it is implemented in the open source software Unicorn which shows near optimal scaling up to thousands of cores. Computational results are presented to demonstrate the capability of our framework.
Keywords: Arbitrary Lagrangian-Eulerian method; blood flow; finite element method; fluid-structure interaction; parallel algorithm; patient specific heart model.
Figures
Similar articles
-
Fluid-Structure Interaction Simulation of Prosthetic Aortic Valves: Comparison between Immersed Boundary and Arbitrary Lagrangian-Eulerian Techniques for the Mesh Representation.PLoS One. 2016 Apr 29;11(4):e0154517. doi: 10.1371/journal.pone.0154517. eCollection 2016. PLoS One. 2016. PMID: 27128798 Free PMC article.
-
Comparison of a fixed-grid and arbitrary Lagrangian-Eulerian methods on modelling fluid-structure interaction of the aortic valve.Proc Inst Mech Eng H. 2019 May;233(5):544-553. doi: 10.1177/0954411919837568. Epub 2019 Mar 29. Proc Inst Mech Eng H. 2019. PMID: 30922162
-
Investigation the effect of geometry and position of polymeric heart valves on hemodynamic with fluid-structure interaction numerical method.Med Eng Phys. 2021 Nov;97:10-17. doi: 10.1016/j.medengphy.2021.09.002. Epub 2021 Sep 17. Med Eng Phys. 2021. PMID: 34756333
-
Toward patient-specific simulations of cardiac valves: state-of-the-art and future directions.J Biomech. 2013 Jan 18;46(2):217-28. doi: 10.1016/j.jbiomech.2012.10.026. Epub 2012 Nov 20. J Biomech. 2013. PMID: 23174421 Free PMC article. Review.
-
Modeling Dynamics of the Cardiovascular System Using Fluid-Structure Interaction Methods.Biology (Basel). 2023 Jul 21;12(7):1026. doi: 10.3390/biology12071026. Biology (Basel). 2023. PMID: 37508455 Free PMC article. Review.
Cited by
-
Fluid-Structure Interaction Models of Bioprosthetic Heart Valve Dynamics in an Experimental Pulse Duplicator.Ann Biomed Eng. 2020 May;48(5):1475-1490. doi: 10.1007/s10439-020-02466-4. Epub 2020 Feb 7. Ann Biomed Eng. 2020. PMID: 32034607 Free PMC article.
-
Turbulent blood dynamics in the left heart in the presence of mitral regurgitation: a computational study based on multi-series cine-MRI.Biomech Model Mechanobiol. 2023 Dec;22(6):1829-1846. doi: 10.1007/s10237-023-01735-0. Epub 2023 Jul 3. Biomech Model Mechanobiol. 2023. PMID: 37400622 Free PMC article.
-
A Doppler-exclusive non-invasive computational diagnostic framework for personalized transcatheter aortic valve replacement.Sci Rep. 2023 May 17;13(1):8033. doi: 10.1038/s41598-023-33511-6. Sci Rep. 2023. PMID: 37198194 Free PMC article.
-
Simulation of semilunar valve function: computer-aided design, 3D printing and flow assessment with MR.3D Print Med. 2020 Feb 3;6(1):2. doi: 10.1186/s41205-020-0057-8. 3D Print Med. 2020. PMID: 32016687 Free PMC article.
-
A partition of unity approach to fluid mechanics and fluid-structure interaction.Comput Methods Appl Mech Eng. 2020 Apr 15;362:112842. doi: 10.1016/j.cma.2020.112842. eCollection 2020 Apr 15. Comput Methods Appl Mech Eng. 2020. PMID: 34093912 Free PMC article.
References
-
- Ahrens J., Geveci B., Law C. (2005). ParaView: An End-User Tool for Large Data Visualization, Visualization Handbook. Oxford: Elsevier.
-
- ANSA (2014). ANSA Pre-processor V.15.2.0.linux.x64.2014. Produced by BETA CAE Systems S.A.
-
- Astorino M., Gerbeau J.-F., Pantz O., Traoré K.-F. (2009). Fluid-structure interaction and multi-body contact: application to aortic valves. Comput. Methods Appl. Mech. Eng. 198, 3603–3612. 10.1016/j.cma.2008.09.012 - DOI
-
- Bellhouse B. J., Talbot L. (1969). The fluid mechanics of the aortic valve. J. Fluid Mech. 35, 721–735. 10.1017/S0022112069001406 - DOI
LinkOut - more resources
Full Text Sources
Other Literature Sources