

Multi-watt, multi-octave, mid-infrared femtosecond source
- PMID: 29713685
- PMCID: PMC5917893
- DOI: 10.1126/sciadv.aaq1526
Multi-watt, multi-octave, mid-infrared femtosecond source
Abstract
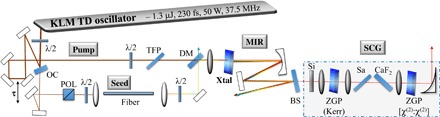
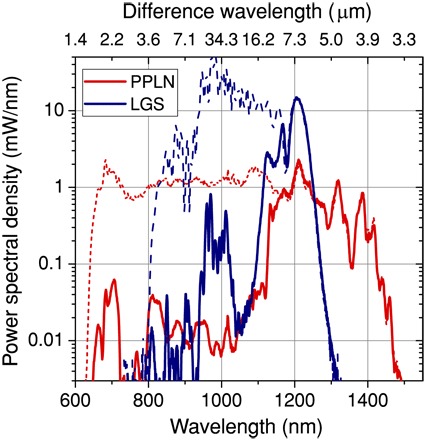
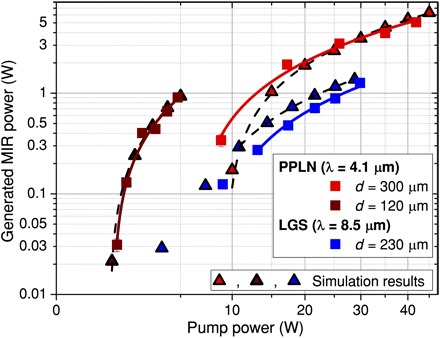
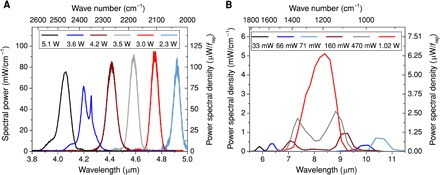
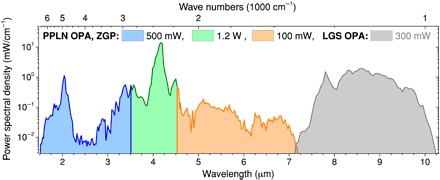
Spectroscopy in the wavelength range from 2 to 11 μm (900 to 5000 cm-1) implies a multitude of applications in fundamental physics, chemistry, as well as environmental and life sciences. The related vibrational transitions, which all infrared-active small molecules, the most common functional groups, as well as biomolecules like proteins, lipids, nucleic acids, and carbohydrates exhibit, reveal information about molecular structure and composition. However, light sources and detectors in the mid-infrared have been inferior to those in the visible or near-infrared, in terms of power, bandwidth, and sensitivity, severely limiting the performance of infrared experimental techniques. This article demonstrates the generation of femtosecond radiation with up to 5 W at 4.1 μm and 1.3 W at 8.5 μm, corresponding to an order-of-magnitude average power increase for ultrafast light sources operating at wavelengths longer than 5 μm. The presented concept is based on power-scalable near-infrared lasers emitting at a wavelength near 1 μm, which pump optical parametric amplifiers. In addition, both wavelength tunability and supercontinuum generation are reported, resulting in spectral coverage from 1.6 to 10.2 μm with power densities exceeding state-of-the-art synchrotron sources over the entire range. The flexible frequency conversion scheme is highly attractive for both up-conversion and frequency comb spectroscopy, as well as for a variety of time-domain applications.
Figures
Similar articles
-
Multi-mW, few-cycle mid-infrared continuum spanning from 500 to 2250 cm-1.Light Sci Appl. 2018 Feb 23;7:17180. doi: 10.1038/lsa.2017.180. eCollection 2018. Light Sci Appl. 2018. PMID: 30839530 Free PMC article.
-
Efficient generation of few-cycle pulses beyond 10 μm from an optical parametric amplifier pumped by a 1-µm laser system.Sci Rep. 2022 Mar 24;12(1):5082. doi: 10.1038/s41598-022-08964-w. Sci Rep. 2022. PMID: 35332211 Free PMC article.
-
Watt-level widely tunable femtosecond mid-infrared KTiOAsO4 optical parametric oscillator pumped by a 1.03 μm Yb:KGW laser.Opt Lett. 2018 Feb 15;43(4):943-946. doi: 10.1364/OL.43.000943. Opt Lett. 2018. PMID: 29444033
-
On-Chip Mid-Infrared Supercontinuum Generation from 3 to 13 μm Wavelength.ACS Photonics. 2020 Dec 16;7(12):3423-3429. doi: 10.1021/acsphotonics.0c01232. Epub 2020 Nov 11. ACS Photonics. 2020. PMID: 33365361 Free PMC article.
-
1.9-3.6 μm supercontinuum generation in a very short highly nonlinear germania fiber with a high mid-infrared power ratio.Opt Lett. 2016 Nov 1;41(21):5067-5070. doi: 10.1364/OL.41.005067. Opt Lett. 2016. PMID: 27805687
Cited by
-
Infrared Comb Spectroscopy of Buffer-Gas-Cooled Molecules: Toward Absolute Frequency Metrology of Cold Acetylene.Int J Mol Sci. 2020 Dec 29;22(1):250. doi: 10.3390/ijms22010250. Int J Mol Sci. 2020. PMID: 33383699 Free PMC article. Review.
-
Mid-infrared feed-forward dual-comb spectroscopy.Proc Natl Acad Sci U S A. 2019 Feb 26;116(9):3454-3459. doi: 10.1073/pnas.1819082116. Epub 2019 Feb 12. Proc Natl Acad Sci U S A. 2019. PMID: 30755528 Free PMC article.
-
Sub-attosecond-precision optical-waveform stability measurements using electro-optic sampling.Sci Rep. 2024 Sep 6;14(1):20869. doi: 10.1038/s41598-024-68848-z. Sci Rep. 2024. PMID: 39242657 Free PMC article.
-
Watt-scale super-octave mid-infrared intrapulse difference frequency generation.Light Sci Appl. 2018 Nov 28;7:94. doi: 10.1038/s41377-018-0099-5. eCollection 2018. Light Sci Appl. 2018. PMID: 30510690 Free PMC article.
-
Ultrabroadband air-dielectric double-chirped mirrors for laser frequency combs.Light Sci Appl. 2025 Aug 19;14(1):280. doi: 10.1038/s41377-025-01961-4. Light Sci Appl. 2025. PMID: 40830332 Free PMC article.
References
-
- P. Hannaford, Femtosecond Laser Spectroscopy (Springer-Verlag, ed. 1, 2005).
-
- Brabec T., Krausz F., Intense few-cycle laser fields: Frontiers of nonlinear optics. Rev. Mod. Phys. 72, 545–591 (2000).
-
- Krausz F., Stockman M. I., Attosecond metrology: From electron capture to future signal processing. Nat. Photonics 8, 205–213 (2014).
-
- Diddams S. A., The evolving optical frequency comb. J. Opt. Soc. Am. B 27, B51–B62 (2010).
-
- Müller M., Kienel M., Klenke A., Gottschall T., Shestaev E., Plötner M., Limpert J., Tünnermann A., 1 kW 1 mJ eight-channel ultrafast fiber laser. Opt. Lett. 41, 3439–3442 (2016). - PubMed
Publication types
LinkOut - more resources
Full Text Sources
Other Literature Sources
Molecular Biology Databases
