. 2018 Oct;32(10):5640-5646.
doi: 10.1096/fj.201800452R. Epub 2018 May 1.

β-Adrenergic receptors control brown adipose UCP-1 tone and cold response without affecting its circadian rhythmicity

Affiliations

β-Adrenergic receptors control brown adipose UCP-1 tone and cold response without affecting its circadian rhythmicity

Maria Razzoli et al. FASEB J. 2018 Oct.

Abstract

Brown adipose tissue (BAT) thermogenic functions are primarily mediated by uncoupling protein (UCP)-1. Ucp1 gene expression is highly induced by cold temperature, via sympathetic nervous system and β-adrenergic receptors (βARs). Ucp1 is also repressed by the clock gene Rev-erbα, contributing to its circadian rhythmicity. In this study, we investigated mice lacking βARs (β-less mice) to test the relationship between βAR signaling and the BAT molecular clock. We found that in addition to controlling the induction of Ucp1 and other key BAT genes at near freezing temperatures, βARs are essential for the basal expression of BAT Ucp1 at room temperature. Remarkably, although basal Ucp1 expression is low throughout day and night in β-less mice, the circadian rhythmicity of Ucp1 and clock genes in BAT is maintained. Thus, the requirement of βAR signaling for BAT activity is independent of the circadian rhythmicity of Ucp1 expression and circadian oscillation of the molecular clock genes. On the other hand, we found that βARs are essential for the normal circadian rhythms of locomotor activity. Our results demonstrate that in addition to controlling the BAT response to extreme cold, βAR signaling is necessary to maintain basal Ucp1 tone and to couple BAT circadian rhythmicity to the central clock.-Razzoli, M., Emmett, M. J., Lazar, M. A., Bartolomucci, A. β-Adrenergic receptors control brown adipose UCP-1 tone and cold response without affecting its circadian rhythmicity.

Keywords: Rev-erbα; brown adipocytes; locomotor activity; molecular clock; thermogenesis.


Conflict of interest statement

The authors thank B. B. Lowell (Beth Israel Deaconess Medical Center, Harvard Medical School, Boston, MA, USA) for providing the β-less mice. This work was supported by U.S. National Institutes of Health, National Institute of Digestive Diabetes and Kidney Diseases Grants DK102496 (to A.B.), DK45586 (to M.A.L.), and F30 DK104513 (to M.J.E). The authors declare no conflicts of interest.

Figures
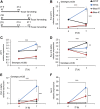
Figure 1
Figure 1
Brown adipose tissue gene expression response to cold challenge in β-less and wild-type mice. Gene expression levels were assayed either at room temperature (22 ± 2°C, room temperature) or after a 3 h of cold exposure (4°C). A) Experimental scheme. B) pre-Ucp1 [genotype effect: F(1,10) = 221.86, P < 0.001; genotype × phase effect: F(2,20) = 14.87, P < 0.001]. C) Ucp1 [genotype effect: F(1,10) = 86.49, P < 0.001; genotype × phase effect: F(2,20) = 5.35, P < 0.05]. D) Rev-erbα [genotype effect: F(1,10) = 18.89, P < 0.01; genotype×phase effect: F(2,20) = 14.87, P < 0.001]. E) PGC1α [genotype effect: F(1,10) = 8.55, P < 0.05; genotype×phase effect: F(2,20) = 7.47, P < 0.001]. F) Nor1 [genotype effect: F(1,10) = 2.03, ns; P = 0.11; genotype×phase effect: F(2,20) = 2.43, NS]. **P < 0.01, ***P < 0.001 at the post hoc level. Data are expressed as group means ± sem.
Figure 2
Figure 2
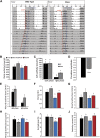
Characterization of circadian activity. A) Mean home-cage activity records of wild-type and β-less mice. Each record represents the mean results of 6 mice/genotype, double plotted by convention, so that each line represents continuous 48-h recordings, and each day is presented both beneath and to the right of the previous day. All animals were maintained on a 12-h LD cycle for the first 9 d shown (lights on at 06:00) indicated by the shaded bars and then transferred to continuous darkness (DD) for the following 9 d. Instances of activity are indicated by the vertical black marks. Onset of activity is indicated in red and acrophase of activity is indicated in blue throughout the recording. B) Overall daily activity recorded as beam break interruption (count) [genotype effect: F(1, 10) = 1.424, ns]. C) Daily activity values split in consideration of the illumination phase during the LD phase of the study [genotype: F(1, 10) = 1.41, ns; genotype×phase: F(1, 10) = 2.31, ns]. D) Circadian activity amplitude measured during the LD phase of the study [genotype effect: F(1, 10) = 56.46; P < 0.0001]. E) Duration of activity bouts in consideration of the illumination phase [genotype effect: F(1, 10) = 5.71, P < 0.05; genotype×phase: F(1, 10) = 2.78, ns]. F) Length of activity period during either the LD or the DD phase (genotype effect: F(1, 10) = 48.8, P < 0.001; F(1, 10) = 0.8, ns). G) Duration of hourly activity period [genotype effect: F(1, 10) = 6.17, P < 0.05; genotype×phase: F(1, 10) = 2.96, ns). H) Frequency of hourly activity periods (genotype effect: F(1, 10) = 3.47, P = 0.09; genotype×phase: F(1, 10) = 1.445, ns]. I) Time of daily acrophase [genotype effect: F(1, 10) = 6.25, P < 0.05; genotype×phase effect: F(1, 10) = 5.73, P < 0.05]. J) Time of daily activity onset [genotype effect: F(1, 10) = 20.91, P < 0.01; genotype × phase effect: F(1, 10) = 3.49, P = 0.09]. ****P < 0.0001. Different letters (ad) represent significant differences at the post hoc level. Data are expressed as group means ± sem.
Figure 3
Figure 3
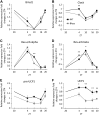
Circadian gene expression in BAT in β-less and wild-type mice. A) Bmal1 [genotype effect: F(1, 6) = 1.36, ns; genotype×ZT effect: F(3, 18) = 7.36, P < 0.01]. B) Clock [genotype effect: F(1, 6) = 9.27, P < 0.05; genotype×ZT effect: F(3, 18) = 2.45, P = 0.09]. C) Rev-erbα [genotype effect: F(1, 6) = 3.13, ns; genotype×ZT effect: F(3, 18) = 10.65, P < 0.01]. D) Rev-erbβ [genotype effect: F(1, 6) = 0.05, ns; genotype×ZT effect: F(3, 18) = 9.27, P < 0.01]. E) pre-Ucp1 [genotype effect: F(1, 6) = 15.94, P < 0.01]. F) Ucp1 [genotype effect: F(1, 6) = 24.58, P < 0.01; genotype×ZT effect: F(3, 18) = 0.24, ns]. *P < 0.05, **P < 0.01 at the level of post hoc comparisons. Data are expressed as group means ± sem.

References

    1. Shearman L. P., Sriram S., Weaver D. R., Maywood E. S., Chaves I., Zheng B., Kume K., Lee C. C., van der Horst G. T., Hastings M. H., Reppert S. M. (2000) Interacting molecular loops in the mammalian circadian clock. Science 288, 1013–1019 - PubMed
    1. Bass J., Lazar M. A. (2016) Circadian time signatures of fitness and disease. Science 354, 994–999 - PubMed
    1. Straif K., Baan R., Grosse Y., Secretan B., El Ghissassi F., Bouvard V., Altieri A., Benbrahim-Tallaa L., Cogliano V.; WHO International Agency For Research on Cancer Monograph Working Group (2007) Carcinogenicity of shift-work, painting, and fire-fighting. Lancet Oncol. 8, 1065–1066 - PubMed
    1. Smolensky M. H., Hermida R. C., Reinberg A., Sackett-Lundeen L., Portaluppi F. (2016) Circadian disruption: new clinical perspective of disease pathology and basis for chronotherapeutic intervention. Chronobiol. Int. 33, 1101–1119 - PubMed
    1. Arble D. M., Ramsey K. M., Bass J., Turek F. W. (2010) Circadian disruption and metabolic disease: findings from animal models. Best Pract. Res. Clin. Endocrinol. Metab. 24, 785–800 - PMC - PubMed

Publication types

MeSH terms

LinkOut - more resources