Population structure in Argentina
- PMID: 29715266
- PMCID: PMC5929549
- DOI: 10.1371/journal.pone.0196325
Population structure in Argentina
Abstract
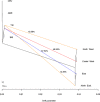
We analyzed 391 samples from 12 Argentinian populations from the Center-West, East and North-West regions with the Illumina Human Exome Beadchip v1.0 (HumanExome-12v1-A). We did Principal Components analysis to infer patterns of populational divergence and migrations. We identified proportions and patterns of European, African and Native American ancestry and found a correlation between distance to Buenos Aires and proportion of Native American ancestry, where the highest proportion corresponds to the Northernmost populations, which is also the furthest from the Argentinian capital. Most of the European sources are from a South European origin, matching historical records, and we see two different Native American components, one that spreads all over Argentina and another specifically Andean. The highest percentages of African ancestry were in the Center West of Argentina, where the old trade routes took the slaves from Buenos Aires to Chile and Peru. Subcontinentaly, sources of this African component are represented by both West Africa and groups influenced by the Bantu expansion, the second slightly higher than the first, unlike North America and the Caribbean, where the main source is West Africa. This is reasonable, considering that a large proportion of the ships arriving at the Southern Hemisphere came from Mozambique, Loango and Angola.
Conflict of interest statement
Figures


References
-
- Pritchard JK, Stephens M, Rosenberg NA, Donnelly P. Association mapping in structured populations. Am. J. Hum. Genet. 2000; 67, 170 doi: 10.1086/302959 - DOI - PMC - PubMed
-
- Freedman ML, Reich D, Penney KL, McDonald GJ, Mignault AA, Patterson N, et al. Assessing the impact of population stratification on genetic association studies. Nat Genet. 2004; 36: 388–93. doi: 10.1038/ng1333 - DOI - PubMed
-
- Marchini J, Cardon LR, Phillips MS, Donnelly P. The effects of human population structure on large genetic association studies. Nat Genet. 2004; 36: 512–17. doi: 10.1038/ng1337 - DOI - PubMed
-
- Campbell CD, Ogburn EL, Lunetta KL, Lyon HN, Freedman ML, Groop LC, et al. Demonstrating stratification in a European American population. Nat Genet. 2005; 37: 868–72. doi: 10.1038/ng1607 - DOI - PubMed
-
- Clayton DG, Walker NM, Smyth DJ, Pask R, Cooper JD, Maier LM, et al. Population structure, differential bias and genomic control in a large-scale, case-control association study. Nat Genet. 2005; 37: 1243–46. doi: 10.1038/ng1653 - DOI - PubMed
Publication types
MeSH terms
Grants and funding
LinkOut - more resources
Full Text Sources
Other Literature Sources

