. 2018 Jun 5;34(22):6601-6611.
doi: 10.1021/acs.langmuir.8b00460. Epub 2018 May 21.

The Lγ Phase of Pulmonary Surfactant

Affiliations

The Lγ Phase of Pulmonary Surfactant

Kamlesh Kumar et al. Langmuir. .

Abstract

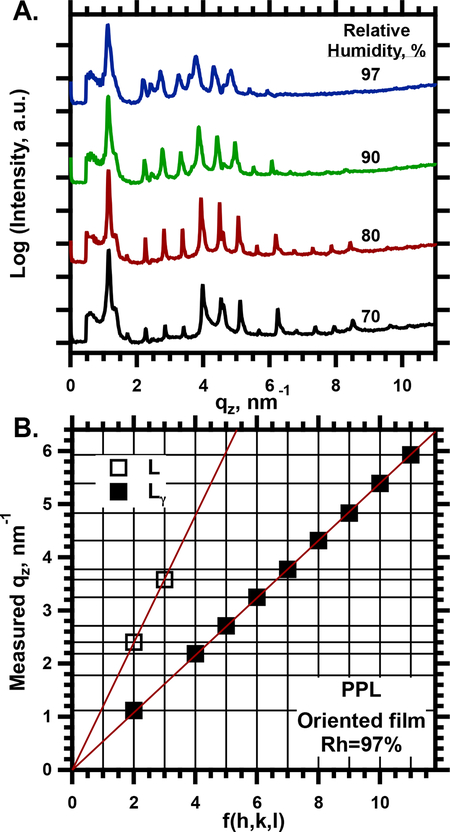
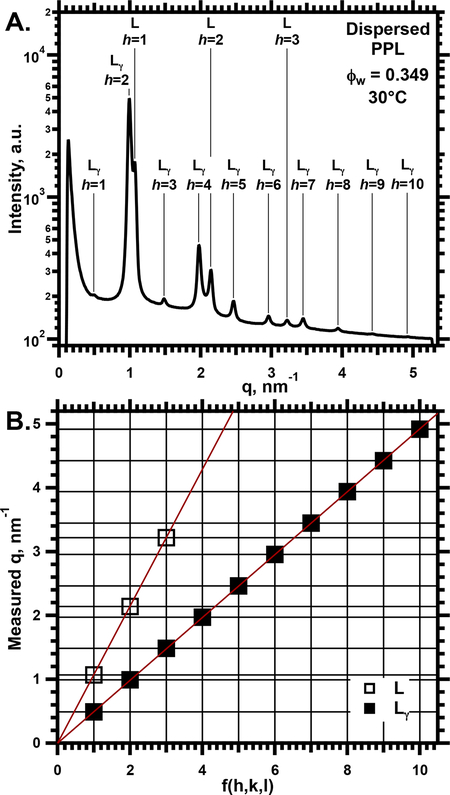
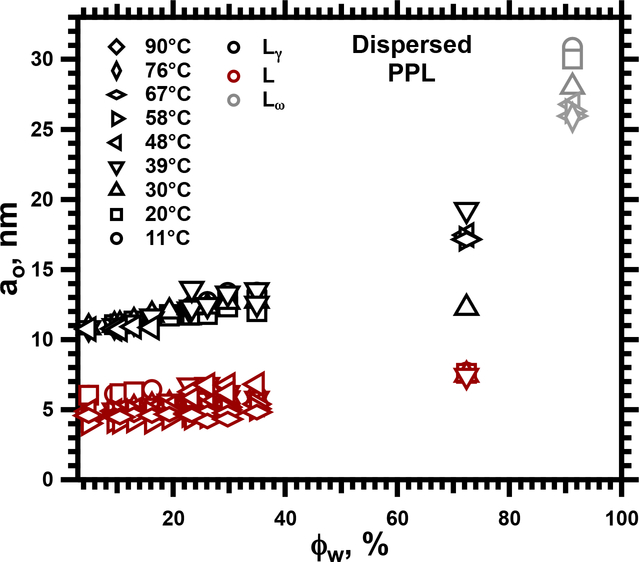
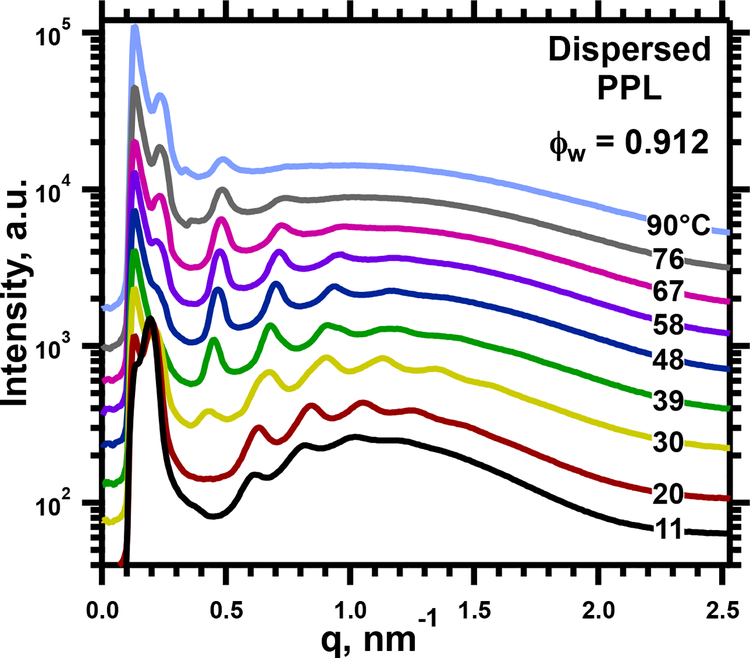
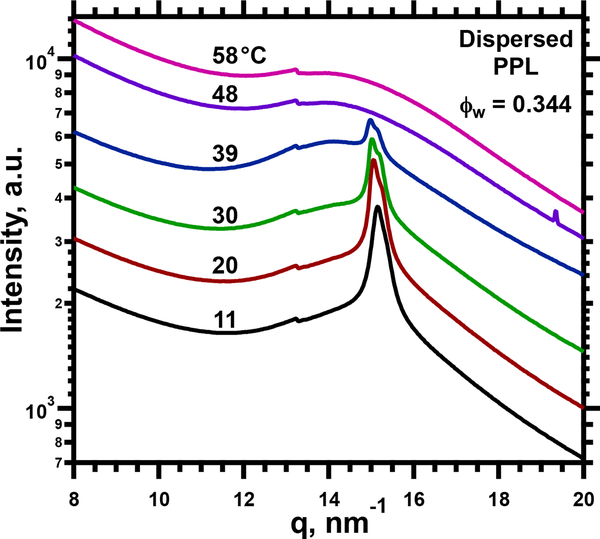
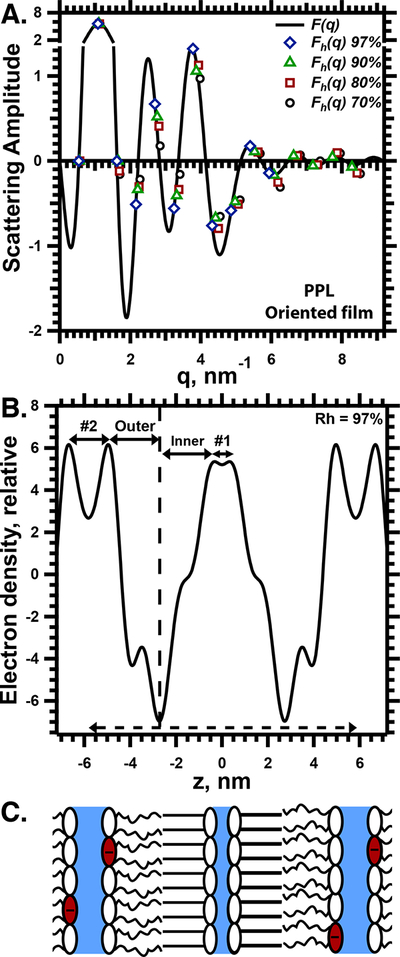
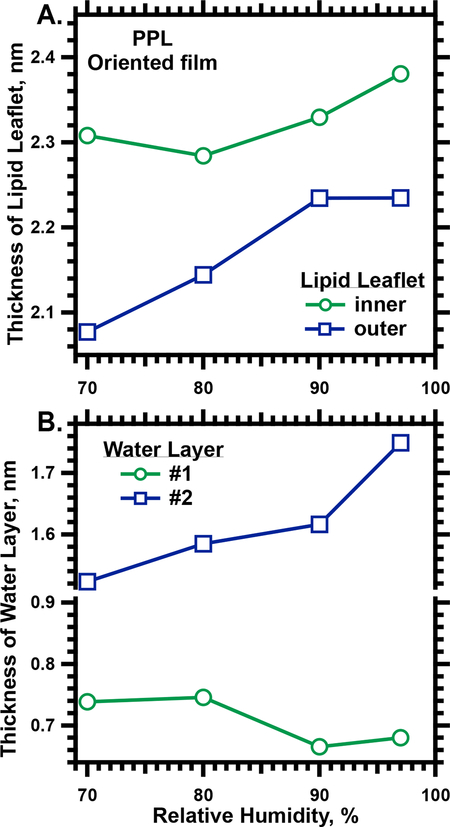
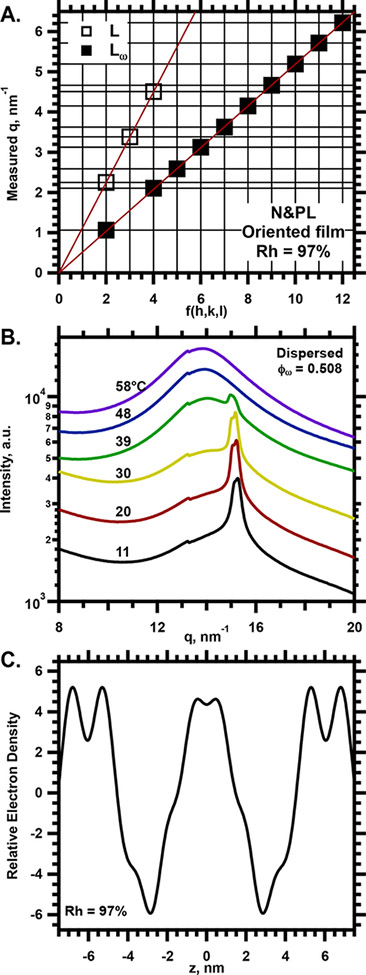
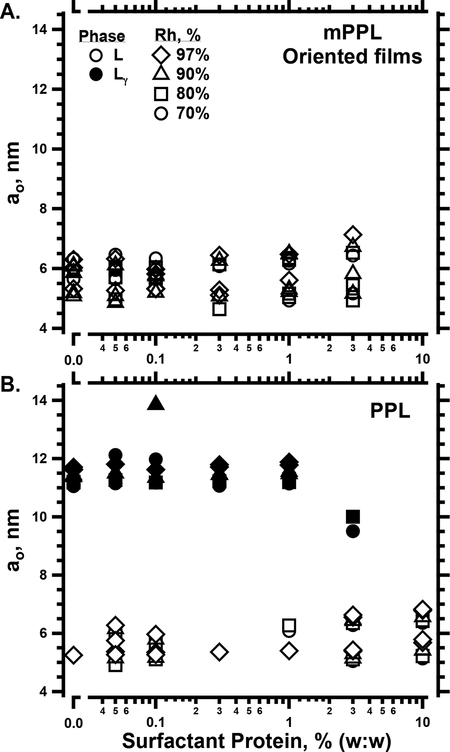
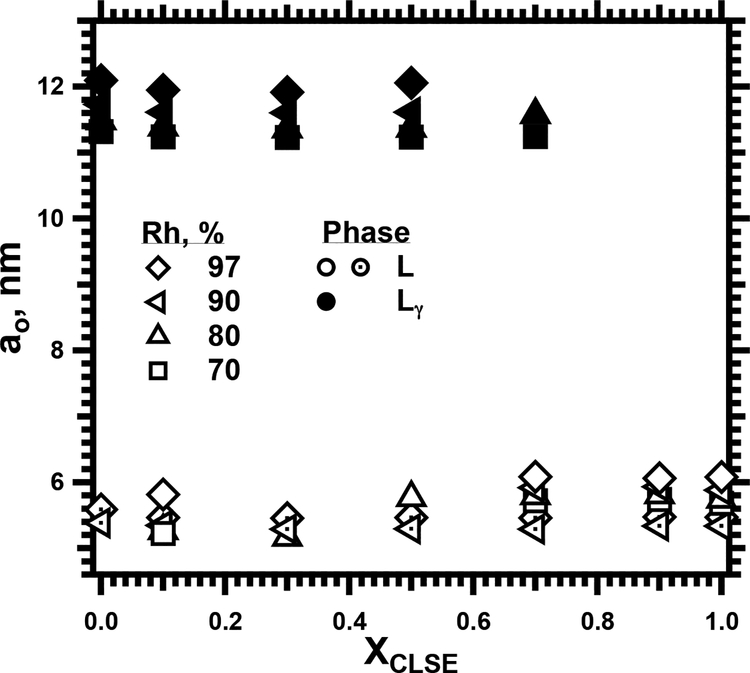
To determine how different components affect the structure of pulmonary surfactant, we measured X-ray scattering by samples derived from calf surfactant. The surfactant phospholipids demonstrated the essential characteristics of the Lγ phase: a unit cell with a lattice constant appropriate for two bilayers, and crystalline chains detected by wide-angle X-ray scattering (WAXS). The electron density profile, obtained from scattering by oriented films at different relative humidities (70-97%), showed that the two bilayers, arranged as mirror images, each contain two distinct leaflets with different thicknesses and profiles. The detailed structures suggest one ordered leaflet that would contain crystalline chains and one disordered monolayer likely to contain the anionic compounds, which constitute ∼10% of the surfactant phospholipids. The spacing and temperature dependence detected by WAXS fit with an ordered leaflet composed of dipalmitoyl phosphatidylcholine. Physiological levels of cholesterol had no effect on this structure. Removing the anionic phospholipids prevented formation of the Lγ phase. The cationic surfactant proteins inhibited Lγ structures, but at levels unlikely related to charge. Because the Lγ phase, if arranged properly, could produce a self-assembled ordered interfacial monolayer, the structure could have important functional consequences. Physiological levels of the proteins, however, inhibit formation of the Lγ structures at high relative humidities, making their physiological significance uncertain.


Figures

1.
1.
SAXS from oriented films of PPL. A. Angular variation of the intensity in the specular plane, I(qz). Traces at relative humidities (Rh) above 70% are shifted vertically without change in scale for clarity of presentation. Temperature = 30°C. B. Diagnostic plot for determining the structural phases present. Horizontal lines give the measured values of qz for the diffraction peaks determined in panel A. Vertical lines give values of fh,k,l=h2+k2+l2 , where h, k, and l are the Miller indices allowed for lamellar phases. The two symbols correspond to coexisting Lγ and standard lamellar phases (L, undifferentiated between Lα and Lβ’) that explain the data. The slope of the line fit through the symbols provides ao for the structure producing diffraction at these qz.
2.
2.
SAXS from dispersed samples of PPL in capillaries. A. I(q) at ϕw = 0.35. Vertically positioned tags indicate assignment of the different peaks according to the diagnostic plots in panel B. B. Diagnostic plots from data in panel A, analogous to Fig. 1B.
3.
3.
Lattice constants, ao, from SAXS for dispersed samples of PPL. Symbols indicate values for the following structures: Lγ; L, indicating a standard lamellar phase, with no distinction between Lα and Lβ’; Lω, for values at conditions for which ao was unavailable for the standard lamellar phase formed by these constituents.
4.
4.
SAXS for dispersed PPL at ϕw = 0.912. Traces at temperatures above 11°C are shifted vertically without change in scale for clarity of presentation.
5.
5.
I(q) for WAXS at ϕw = 0.344 and different temperatures achieved during heating. The traces at temperatures above 11°C are shifted vertically without change in scale for clarity of presentation.
6.
6.
Structural analysis of PPL in oriented films. A. Variation of the calculated scattering amplitude, F(q). The y-axis is broken to display the full range of values while emphasizing lower amplitudes. The symbols give F(qh) for diffraction at different Rh, used to vary the lattice-constant and the angles of diffraction. The trend of F with increasing q establishes whether the sign of F changes between sequential values of h. The continuous curve of F(q), calculated for Rh = 97%, assumes a positive sign for F(qh=2). B. The electron density profile for Rh = 97%. z is the distance perpendicular to the bilayers, centered at the plane of symmetry. The calculations used the signs for F(qh) determined in panel A. The dashed vertical line indicates the middle of a bilayer. The solid horizontal lines with arrows indicate the width of the two aqueous layers (#1 and #2) and the two leaflets of the bilayer (inner and outer). The dashed horizontal line with arrows indicates the dimension of the unit cell. C. Proposed diagram of the unit cell, in register with the electron density profile in panel B. The schematic indicates the location of the ordered and disordered monolayers, and the two aqueous layers (blue), as well as the speculative location of the anionic headgroups (red).
7.
7.
The thickness for components of the Lγ phase formed by PPL. A. Thickness of the two leaflets in the bilayer, determined from the distance between the minimum density at the center of the bilayer and the adjacent maxima (Fig. 6B). B. Thickness of the aqueous layers, determined from the distance between adjacent maxima in the electron density profile (Fig. 6B). The y-axis is split to optimize display of the variation with Rh.
8.
8.
X-ray scattering from N&PL. A. Diagnostic plot, based on I(q) measured by SAXS from oriented films, for Rh = 97%. B. WAXS from dispersed samples at ϕw = 0.508. Traces at temperatures above 11°C are shifted vertically without change in scale. C. Electron density profile, calculated from the diffracted intensities obtained by SAXS from oriented films.
9.
9.
Structural effects of the anionic phospholipids and surfactant proteins on supported films containing the surfactant phospholipids. Oriented films at 30°C contained the physiological mixture of the two hydrophobic surfactant proteins, in amounts expressed as % (w:w), combined with phospholipids. Diagnostic plots (Fig. 1B) determined the structural phases and lattice constants, ao, for: Lγ (only present in panel B); and standard lamellar structures (L), with no distinction between Lα and Lβ’. The legend applies to both panels. A. mPPL, containing PPL modified by removal of anionic compounds. B. PPL.
10.
10.
Structural effects of the hydrophobic surfactant proteins on supported films containing the complete set of surfactant lipids. Samples contained the complete surfactant extract, CLSE, with both the lipids and the proteins, combined with different amounts of the surfactant lipids without the proteins, N&PL. The mol fraction of phospholipid from CLSE (XCLSE) expressed the relative amounts of the two preparations present. Several samples contained more than one coexisting lamellar phase (L) with a standard ao, indicated by distinct symbols.

References

    1. Nag K; Perez-Gil J; Ruano ML; Worthman LA; Stewart J; Casals C; Keough KM Phase transitions in films of lung surfactant at the air-water interface. Biophys. J 1998, 74 (6), 2983–95. - PMC - PubMed
    1. Gaines GL Insoluble Monolayers at Liquid-Gas Interfaces. Interscience Publishers: New York, 1966, pp 144–151.
    1. Schief WR; Antia M; Discher BM; Hall SB; Vogel V Liquid-crystalline collapse of pulmonary surfactant monolayers. Biophys. J 2003, 84 (6), 3792–3806. - PMC - PubMed
    1. Horie T; Hildebrandt J Dynamic compliance, limit cycles, and static equilibria of excised cat lung. J. Appl. Physiol 1971, 31 (3), 423–30. - PubMed
    1. Valberg PA; Brain JD Lung surface tension and air space dimensions from multiple pressure-volume curves. J. Appl. Physiol 1977, 43 (4), 730–8. - PubMed

Publication types

LinkOut - more resources